Navigating the dashboard
Guide to how to find your way around your dashboard and its structure.
Please see our recent Webinar showing you around the new dashboard:
1. Sections
Your dashboard is divided into Sections, each section has a distinct purpose and gathers different types of data for you to use:

Tip: the left side navigation can be extended by clicking on the yellow zone.
Visitors
Track your project traffic sources and ensure that you are visible where it matters.
This page uses unique visitors per days.
This means that 1 person coming back 100 times within 24 hours will count as 1.
In another hand, 1 person visiting 1 time per day 7 days in a row will count as 7.

Respondents
Analyse who comments on your project and the demographics you cover.
Contributions
Dive into what people say about your project and share your analysis in elaborate reports.
2. Tabs
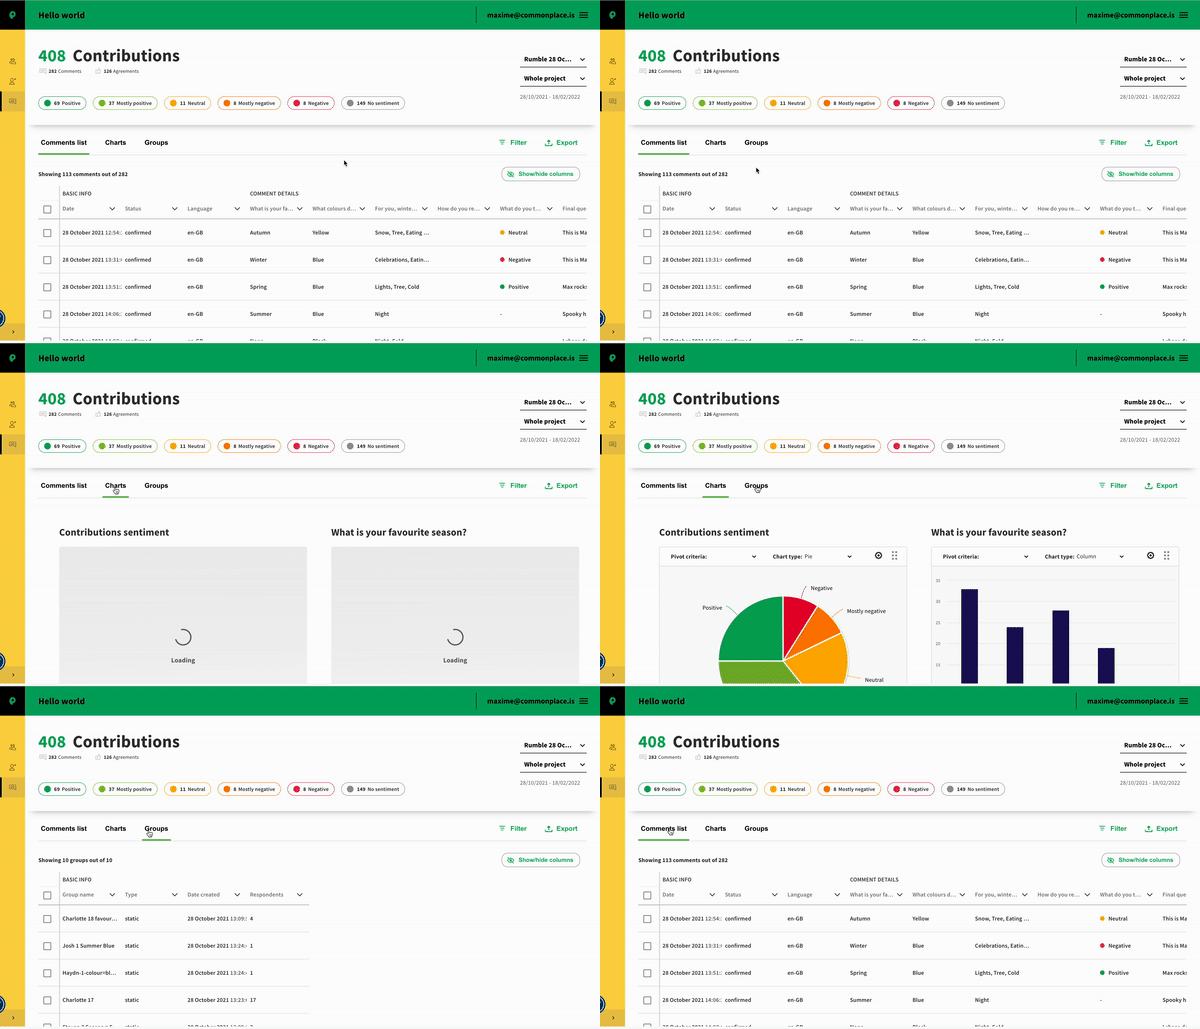
Visitors, Respondents and Contributions are each separated in tabs. Tabs are a lower level of navigation that allows you to see your data in different ways.

Tip: when switching between tabs in a section, the filters stay applied.
Tables
This first tab gathers the raw data. It can be filtered, grouped, re-organised and exported.
Charts
This tab displays the same data as on tables in an easy to analyse way.
Charts can be filtered, re-organised and exported.
Learn more about using the charts here.
Groups
This tabs displays all the groups created and their key metrics.
3. Content
Each section and tab can be divided in 3 parts.
Note: these 3 parts are not present on all pages.
Top filters
This part allows you to set high level filters that will change the scope of the data to visualise.
They will stay active when navigating through your various tabs.
Other filters
This part allows you to set contextual filters. This filters can be related to the question data, and can have various natures.
For a more in depth article about the table customisation, please click here.
Table and data
The final part will display the actual data.
It can be reworked to suit your needs, and clicking on a row will lead to a detailed view of the element.