The 2.0 superior map capabilities can be categorised as follows:
Navigation
Either as a map featured on the hub page or a standalone map page, navigational features can be included to:
- Shapes, routes and focus area (can be uploaded (shape file or geoJSON) or drawn using map edit mode)
- Highlight specific local landmarks by adding an icon on the map (possible using map edit mode if added one by one)
- Signposting to other content (possible using map edit mode if added one by one)
- Overlay image on maps to illustrate the future or a proposal
- 3D points that let people change the view between 3D and map view
Engagement
- Sentiment pins and clusters
- Neutral pins
- Themed pins
- Filtering pins based on themes and question answers on public map (coming soon)
- Map interaction types: specific location (point), route (line) or area (polygon) (coming soon)
- Your own GIS and open datasets (coming soon)
Analysis
- Reverse geocoded locations (coming soon)
- Grouping comments by location and theme (coming soon)
- Map analysis on dashboard (coming soon)
Shapes, routes and focus area


Highlight specific local landmarks
Icons and symbols can be added to the 2.0 map. These icons can be stand alone or show an information panel when hovered on desktop or tapped on mobile.
If it's just a few icons, these can be added manually using edit mode. If there are a few, they can be added via the backend if the data is provided in .excel or .csv format. Please talk to your CSM for details.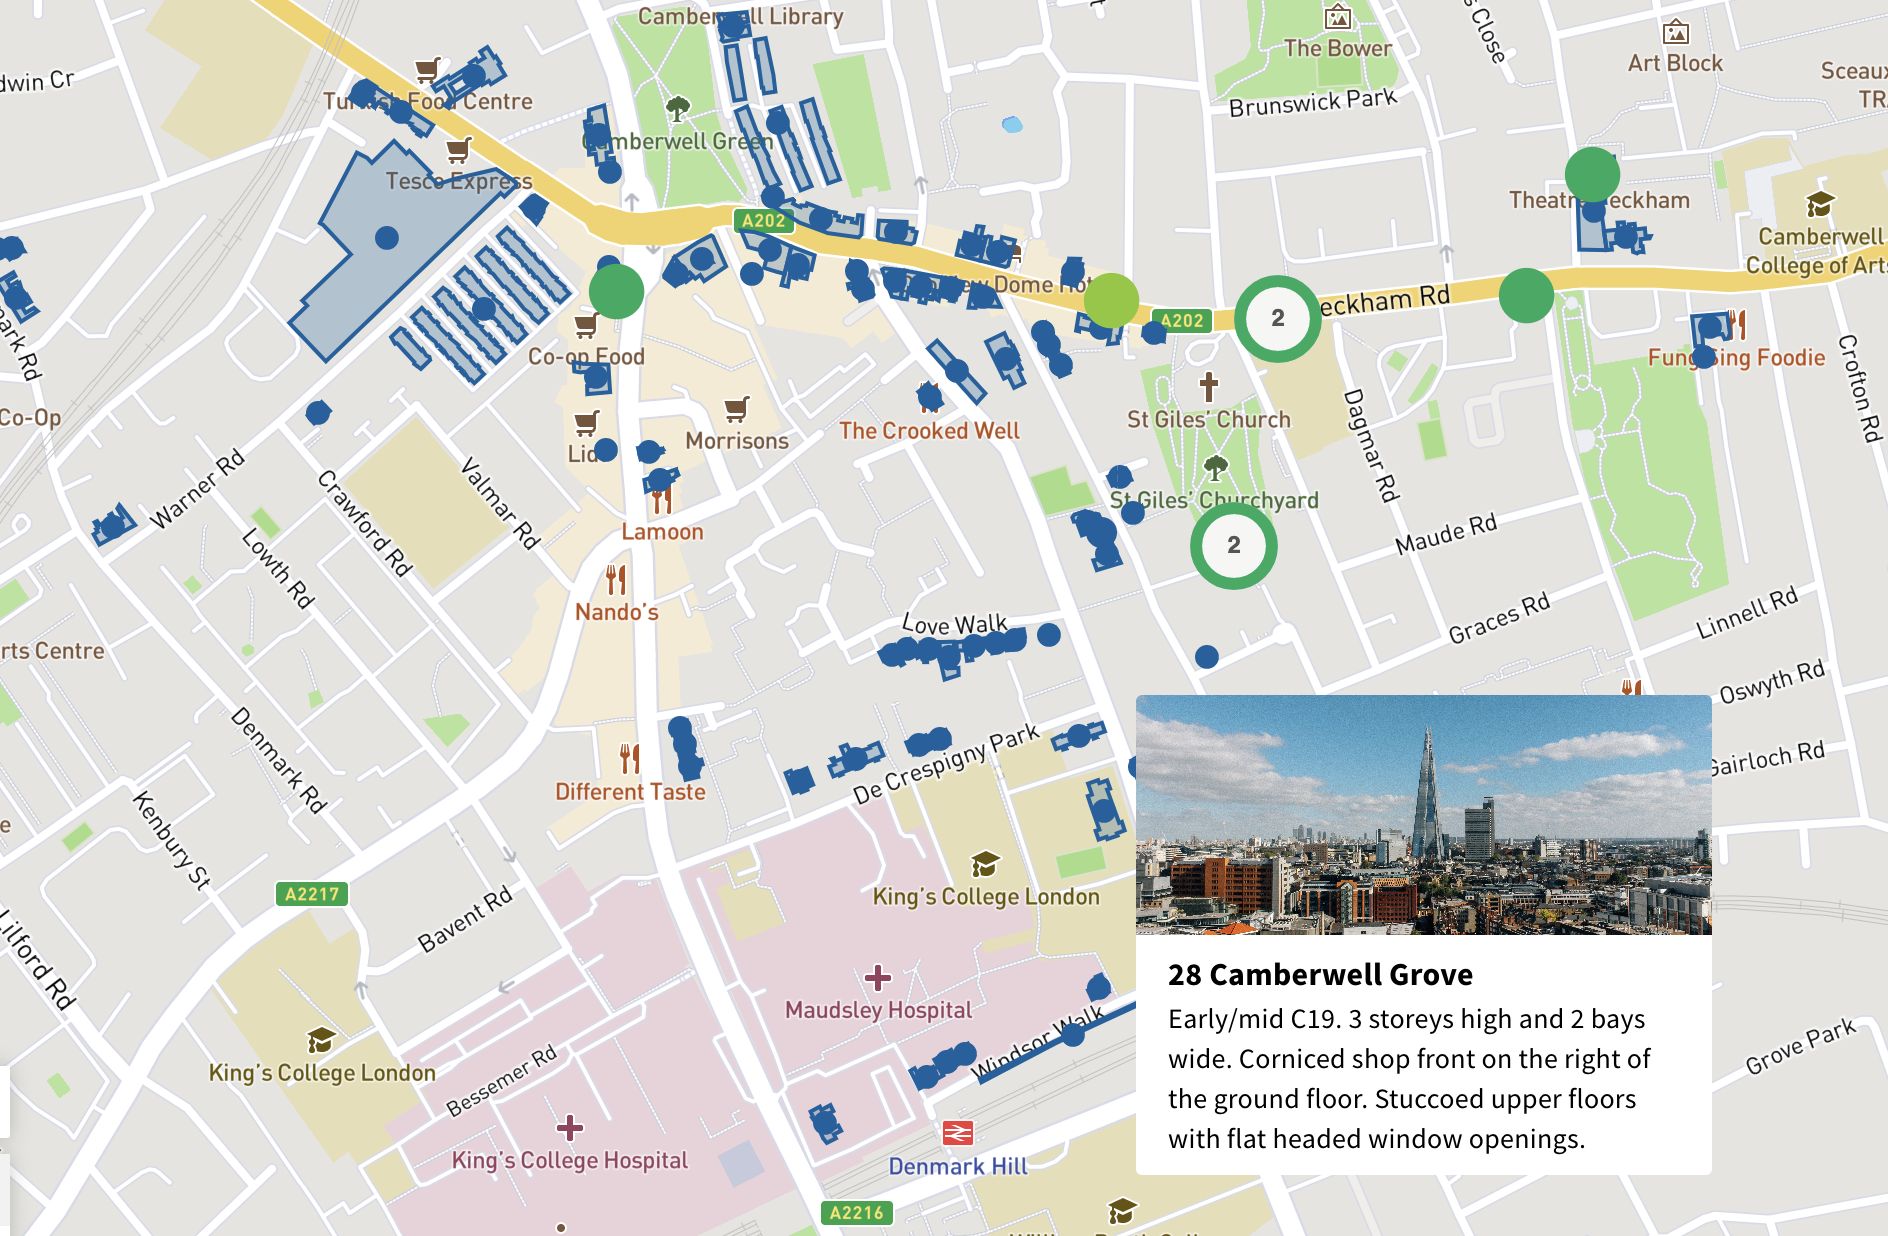 Example: Map shows footprints of buildings that members of the public can suggest to be listed for heritage. Each building has an information point that shows details about each site: Building name and short summary.
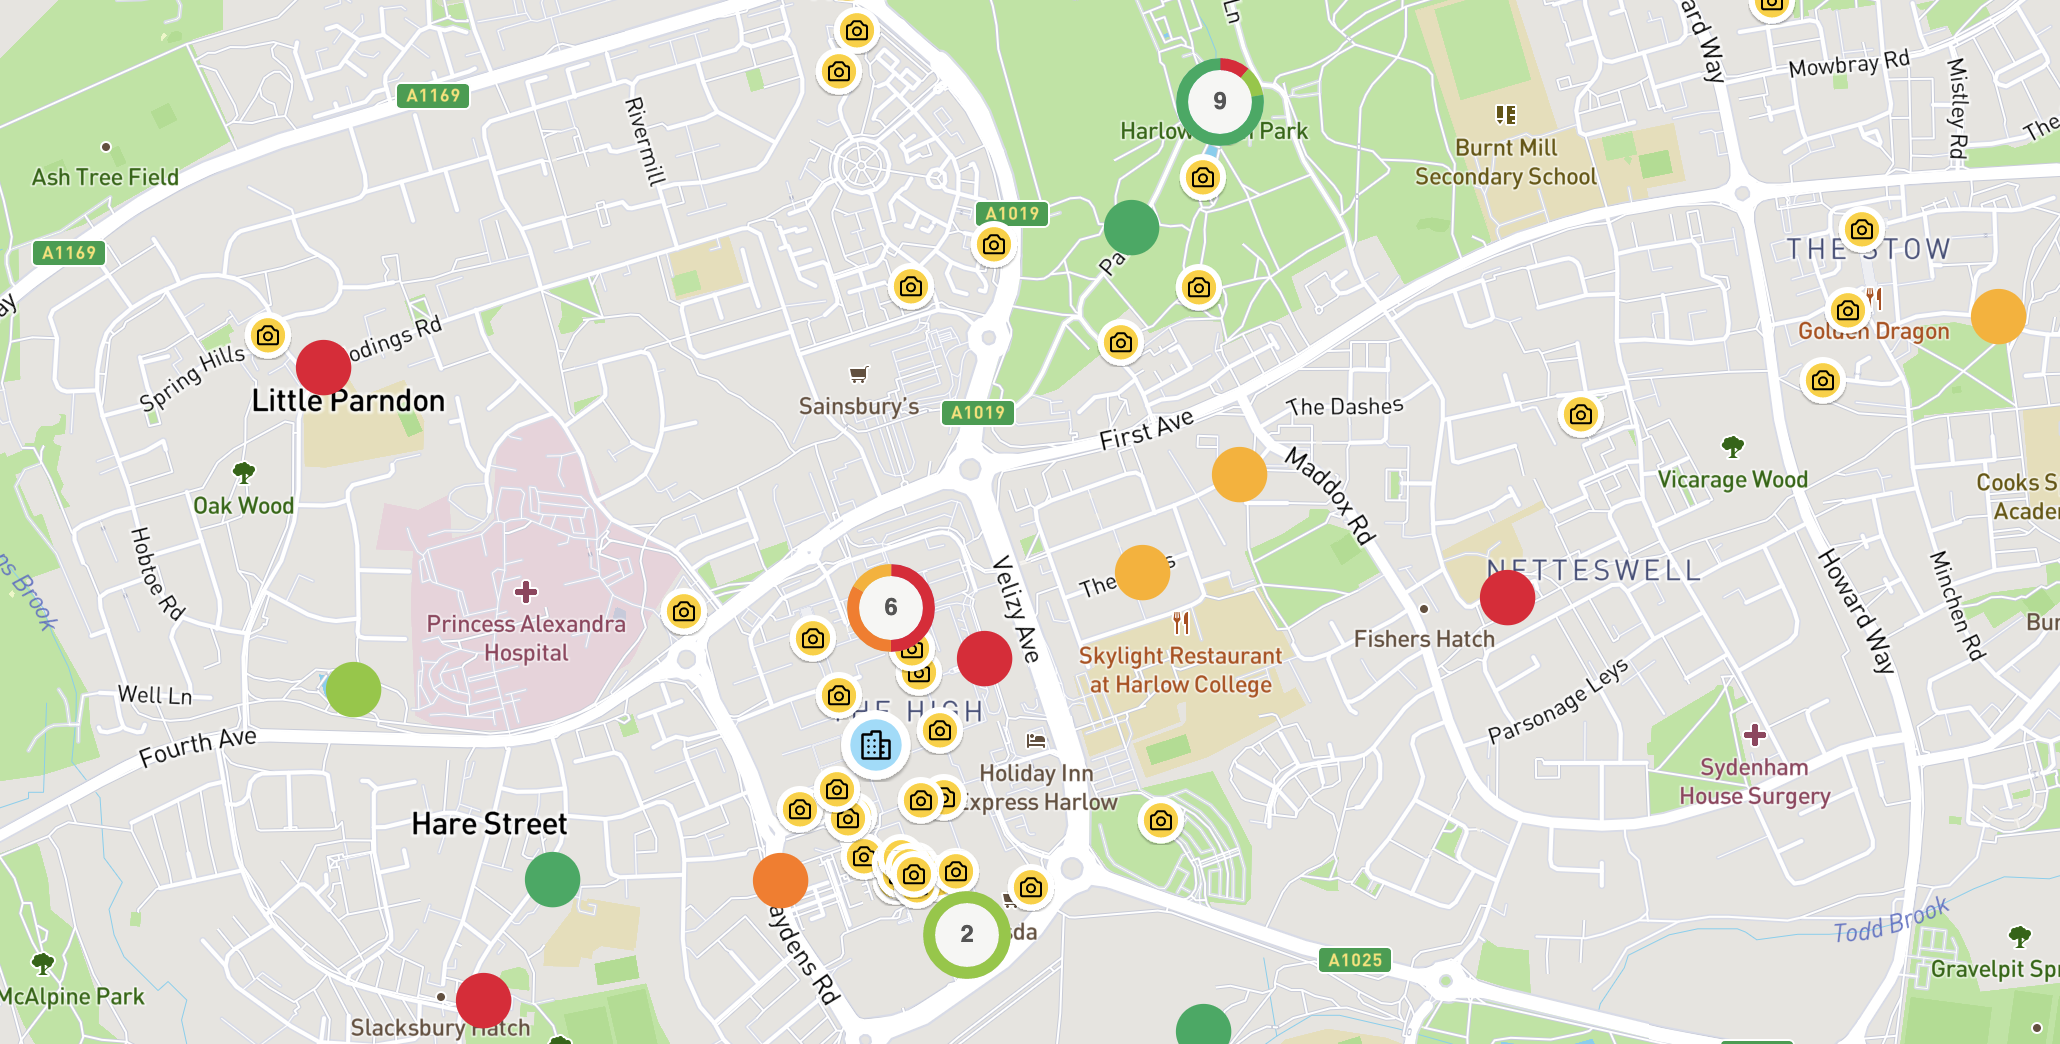 Example: Highlight photo spots and a heritage trail. People can comment like usual.
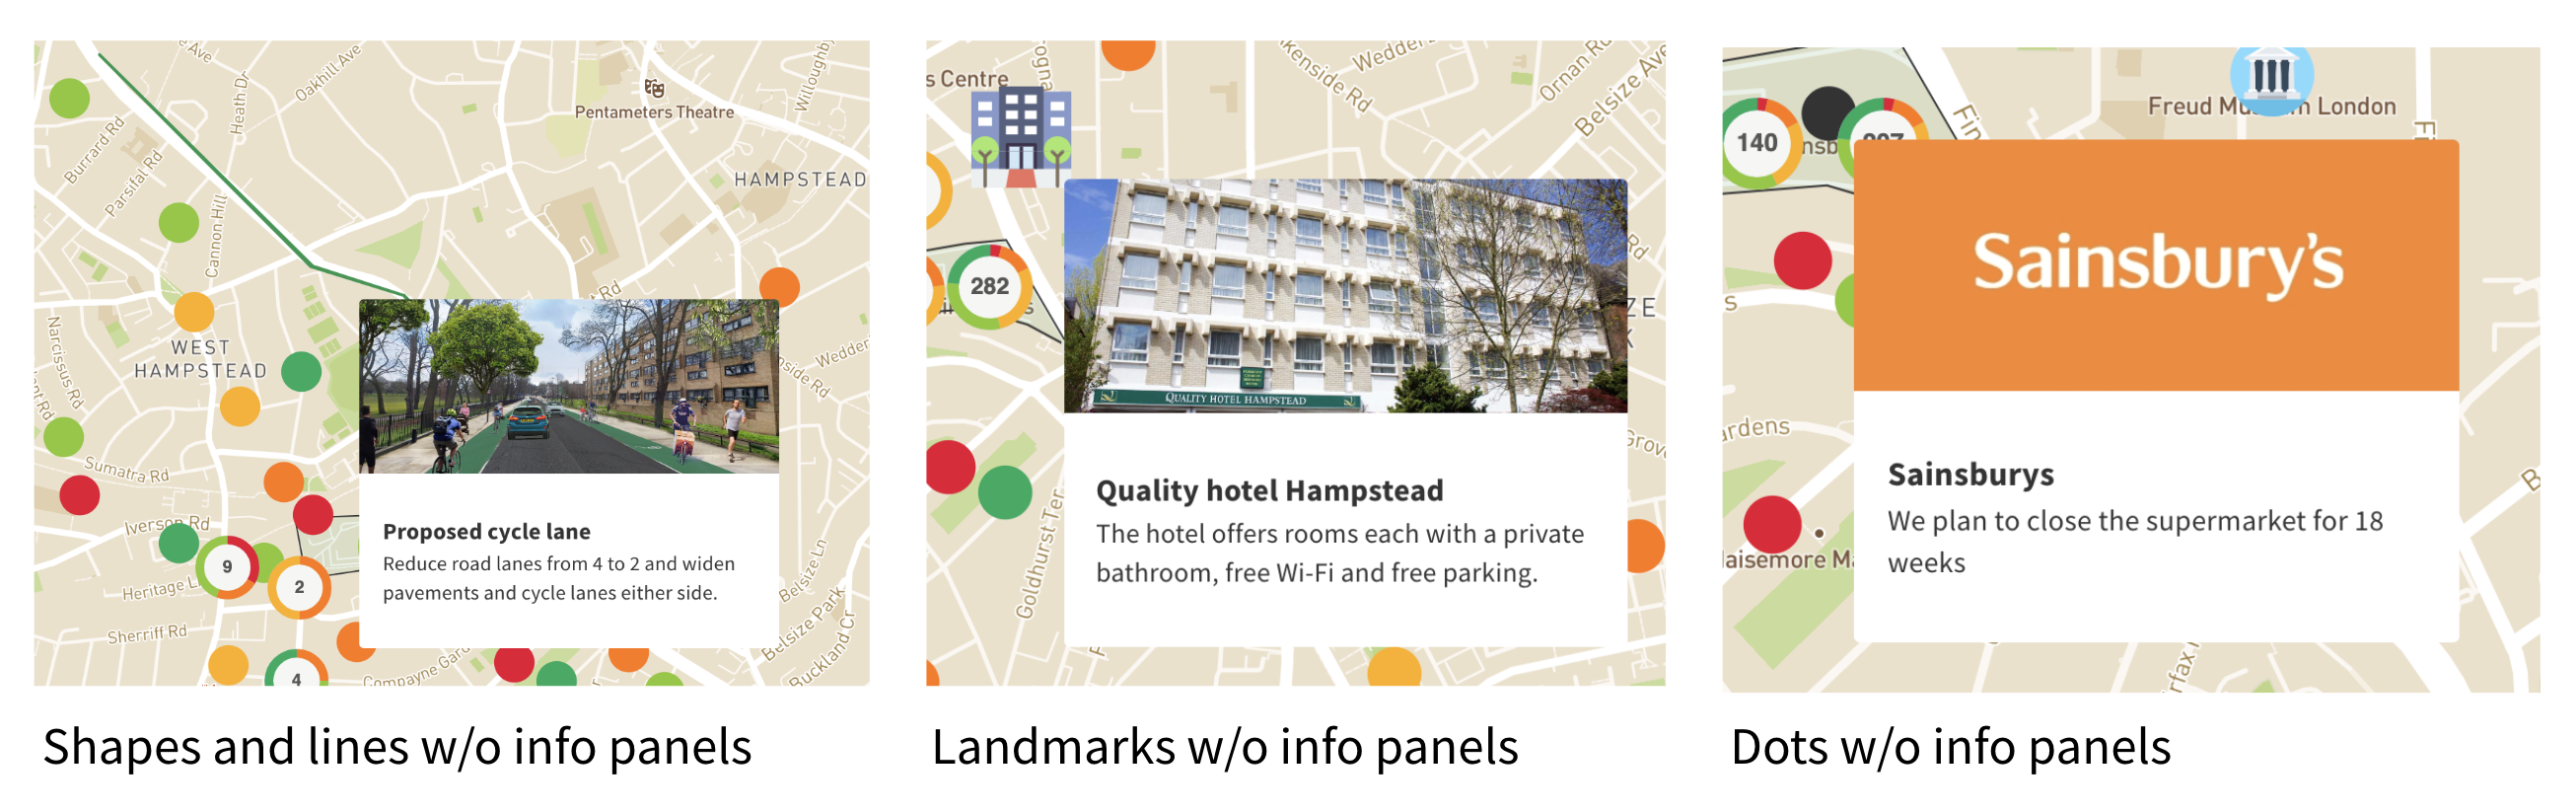
Signposting to other content
Shapes, lines and points can link through to other content of the Commonplace. For example the below example lets respondents identify an area that they like to learn more about using the map. Clicking on the information panel opens a page with questions about this area's proposal.
This can either be added to a main map or featured on the hub page as a navigational map to support respondents find relevant proposals based on a map view.
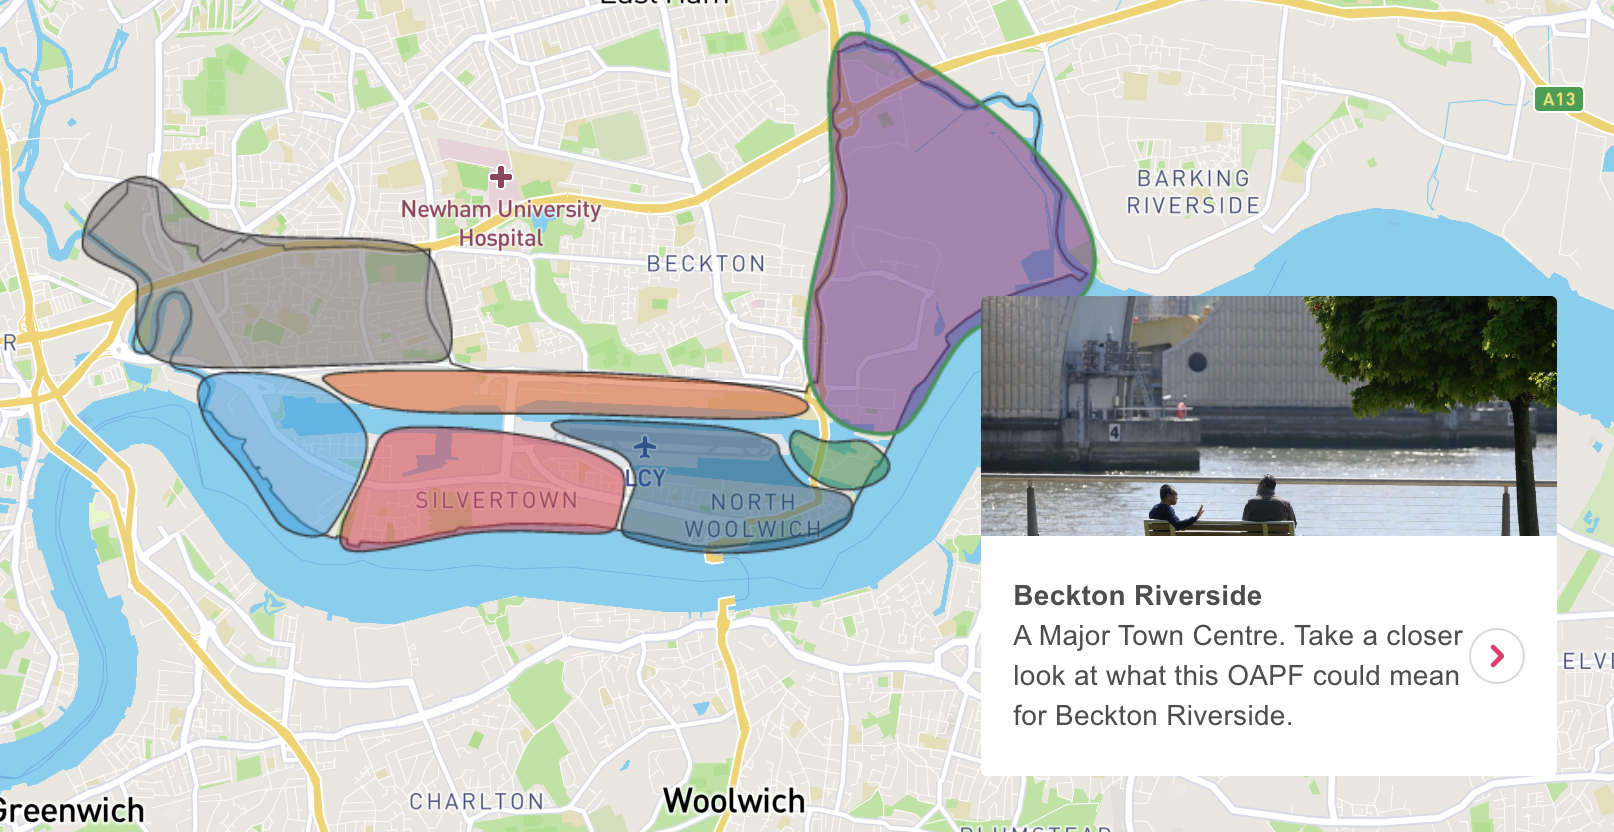
Example above: Royal docks
Overlay image on maps
Images can be overlayed on top of the map. This can be used to illustrate new road layouts such as road closures and other proposals for the regeneration of an area. CSM team will need to assist you with overlaying these images.
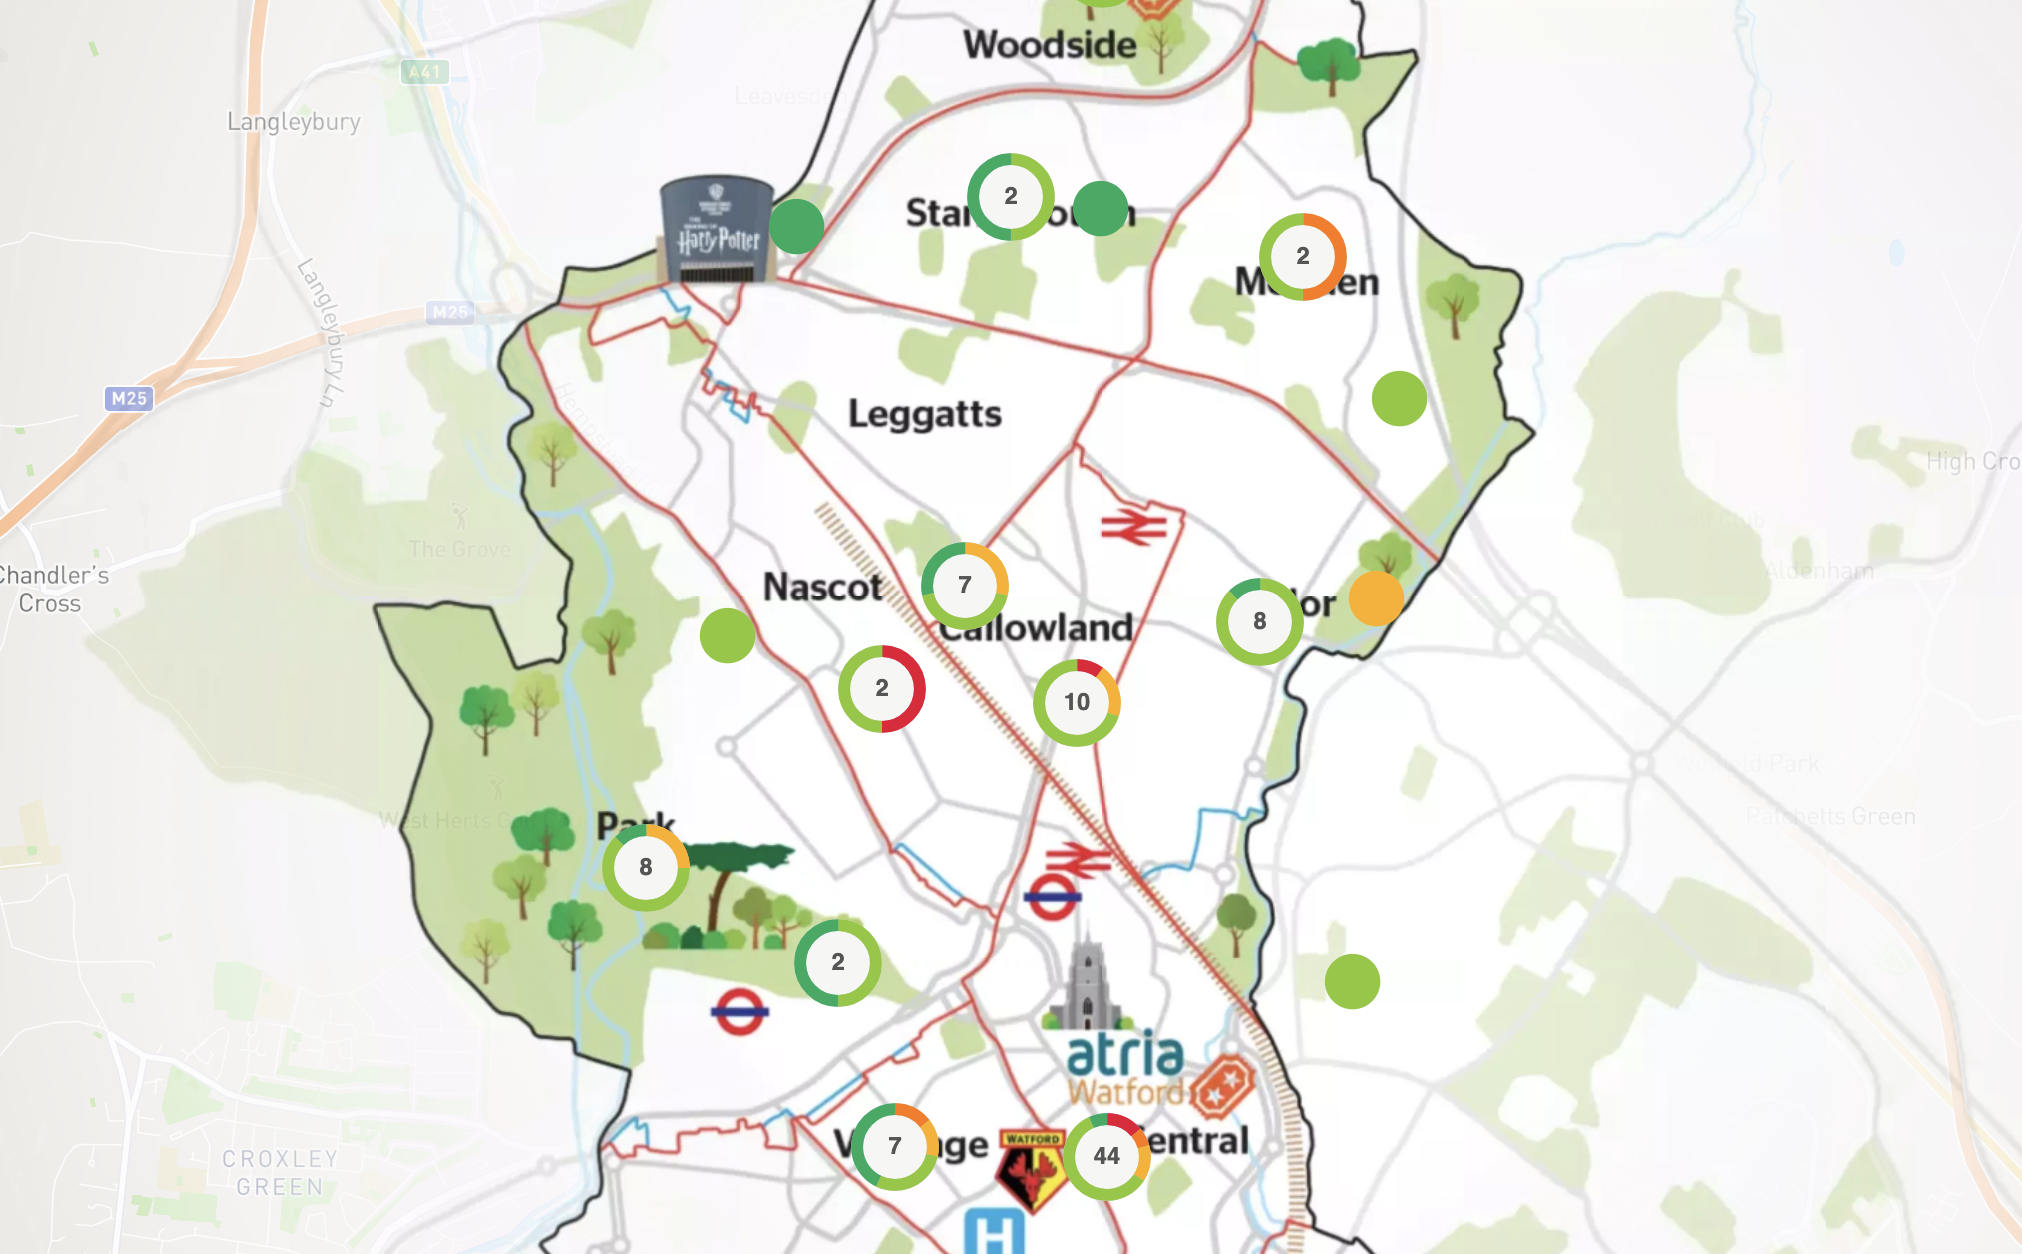
Example: Watford neighbourhood map. Simplifying the map with an overlay.
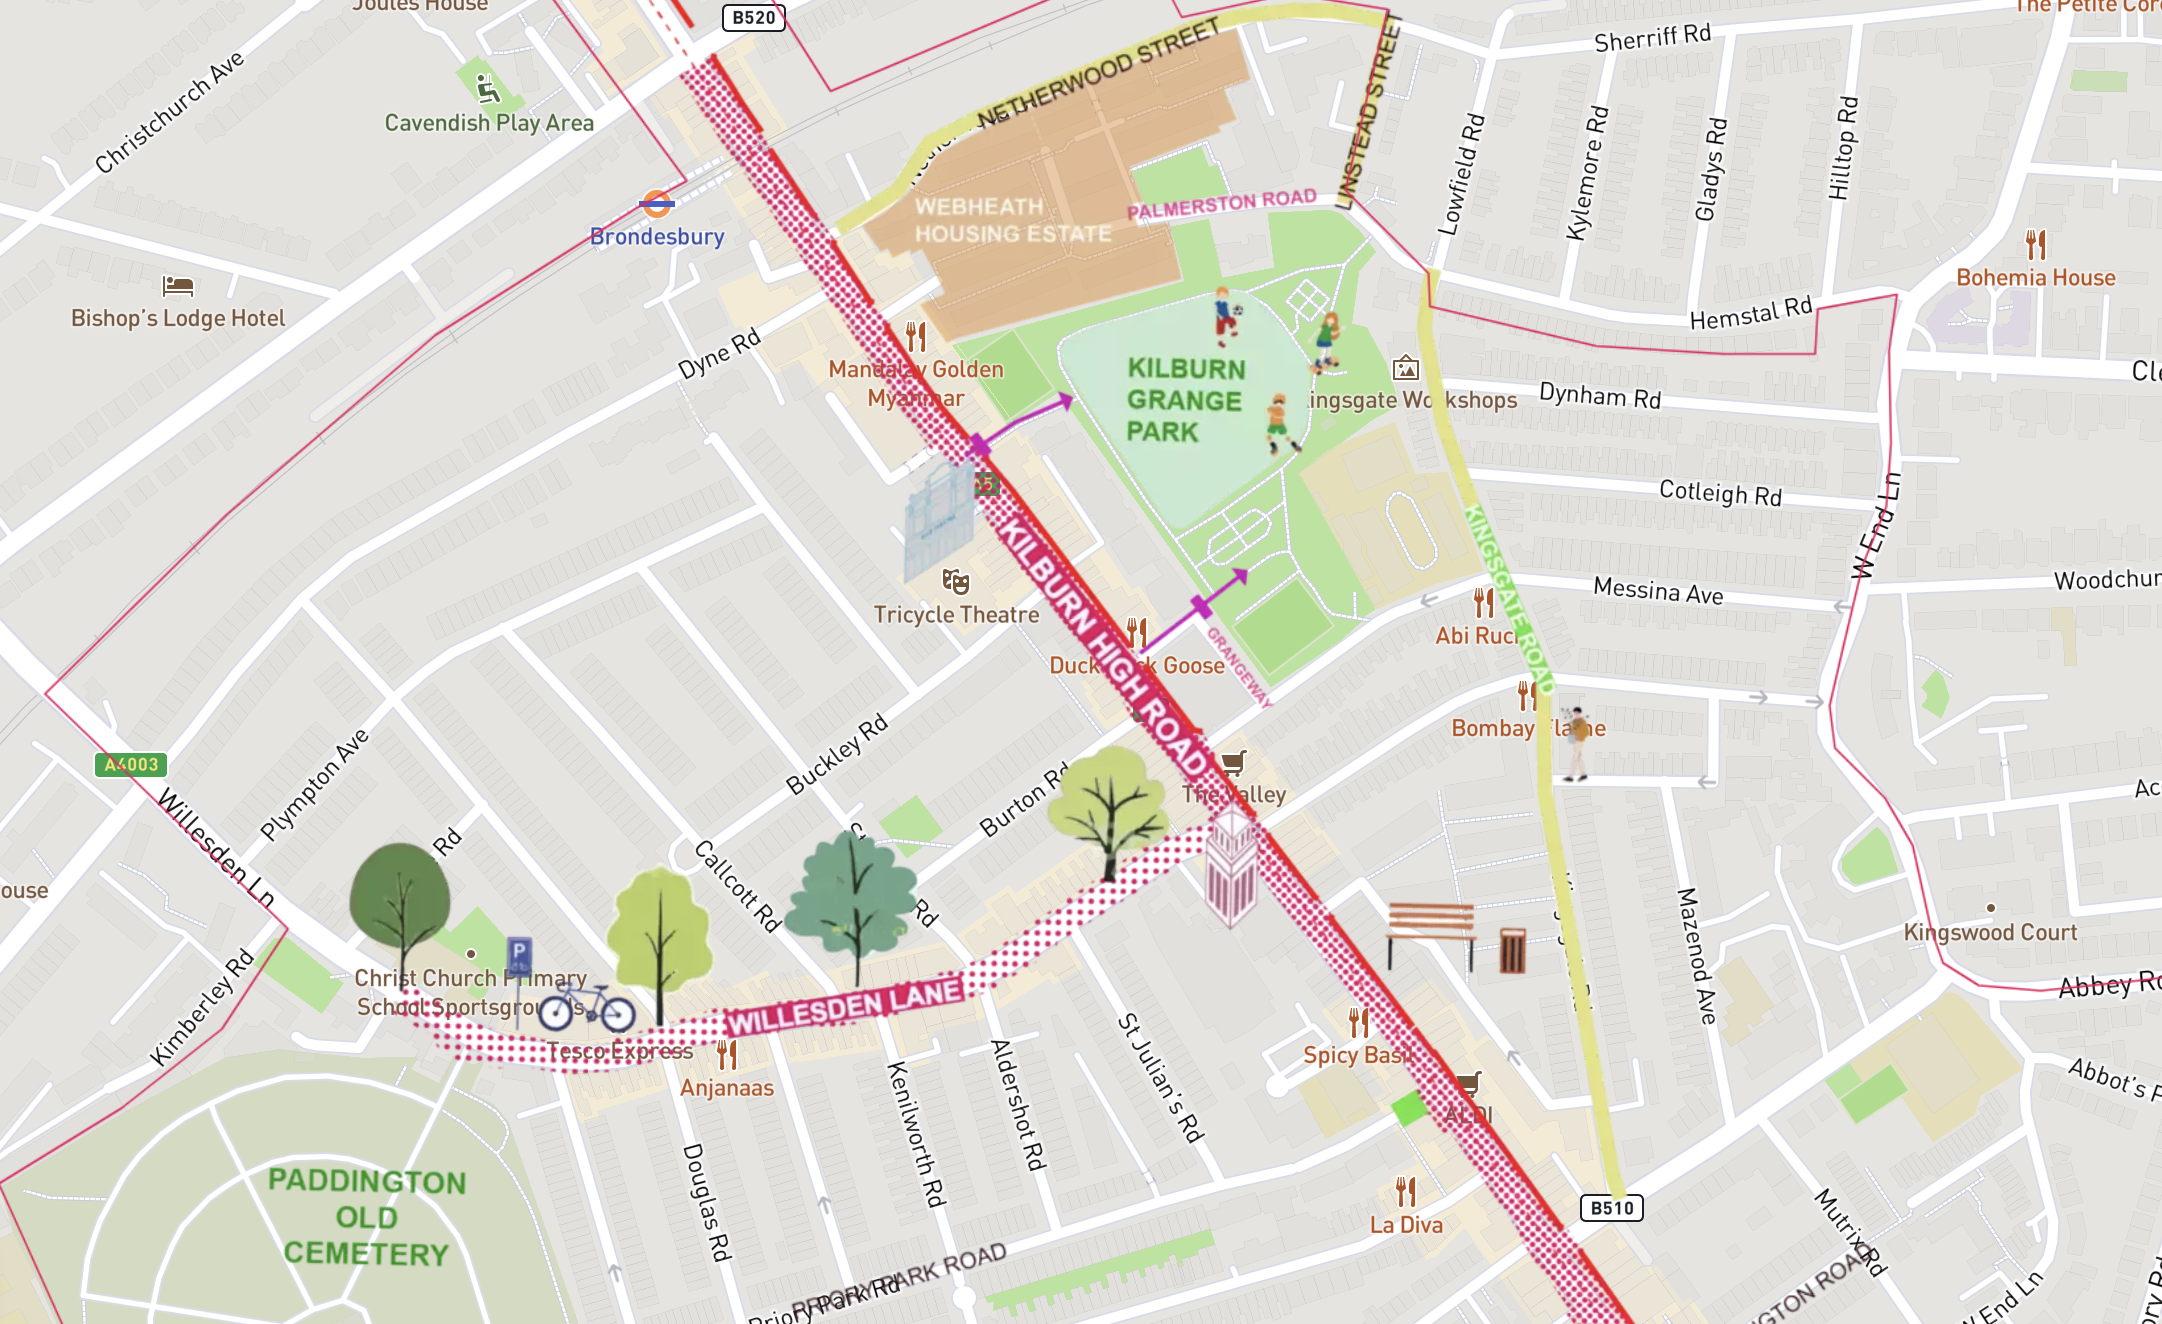
Example: Map highlighting community spaces. Could also be used to represent new cycle lane and pedestrian area.
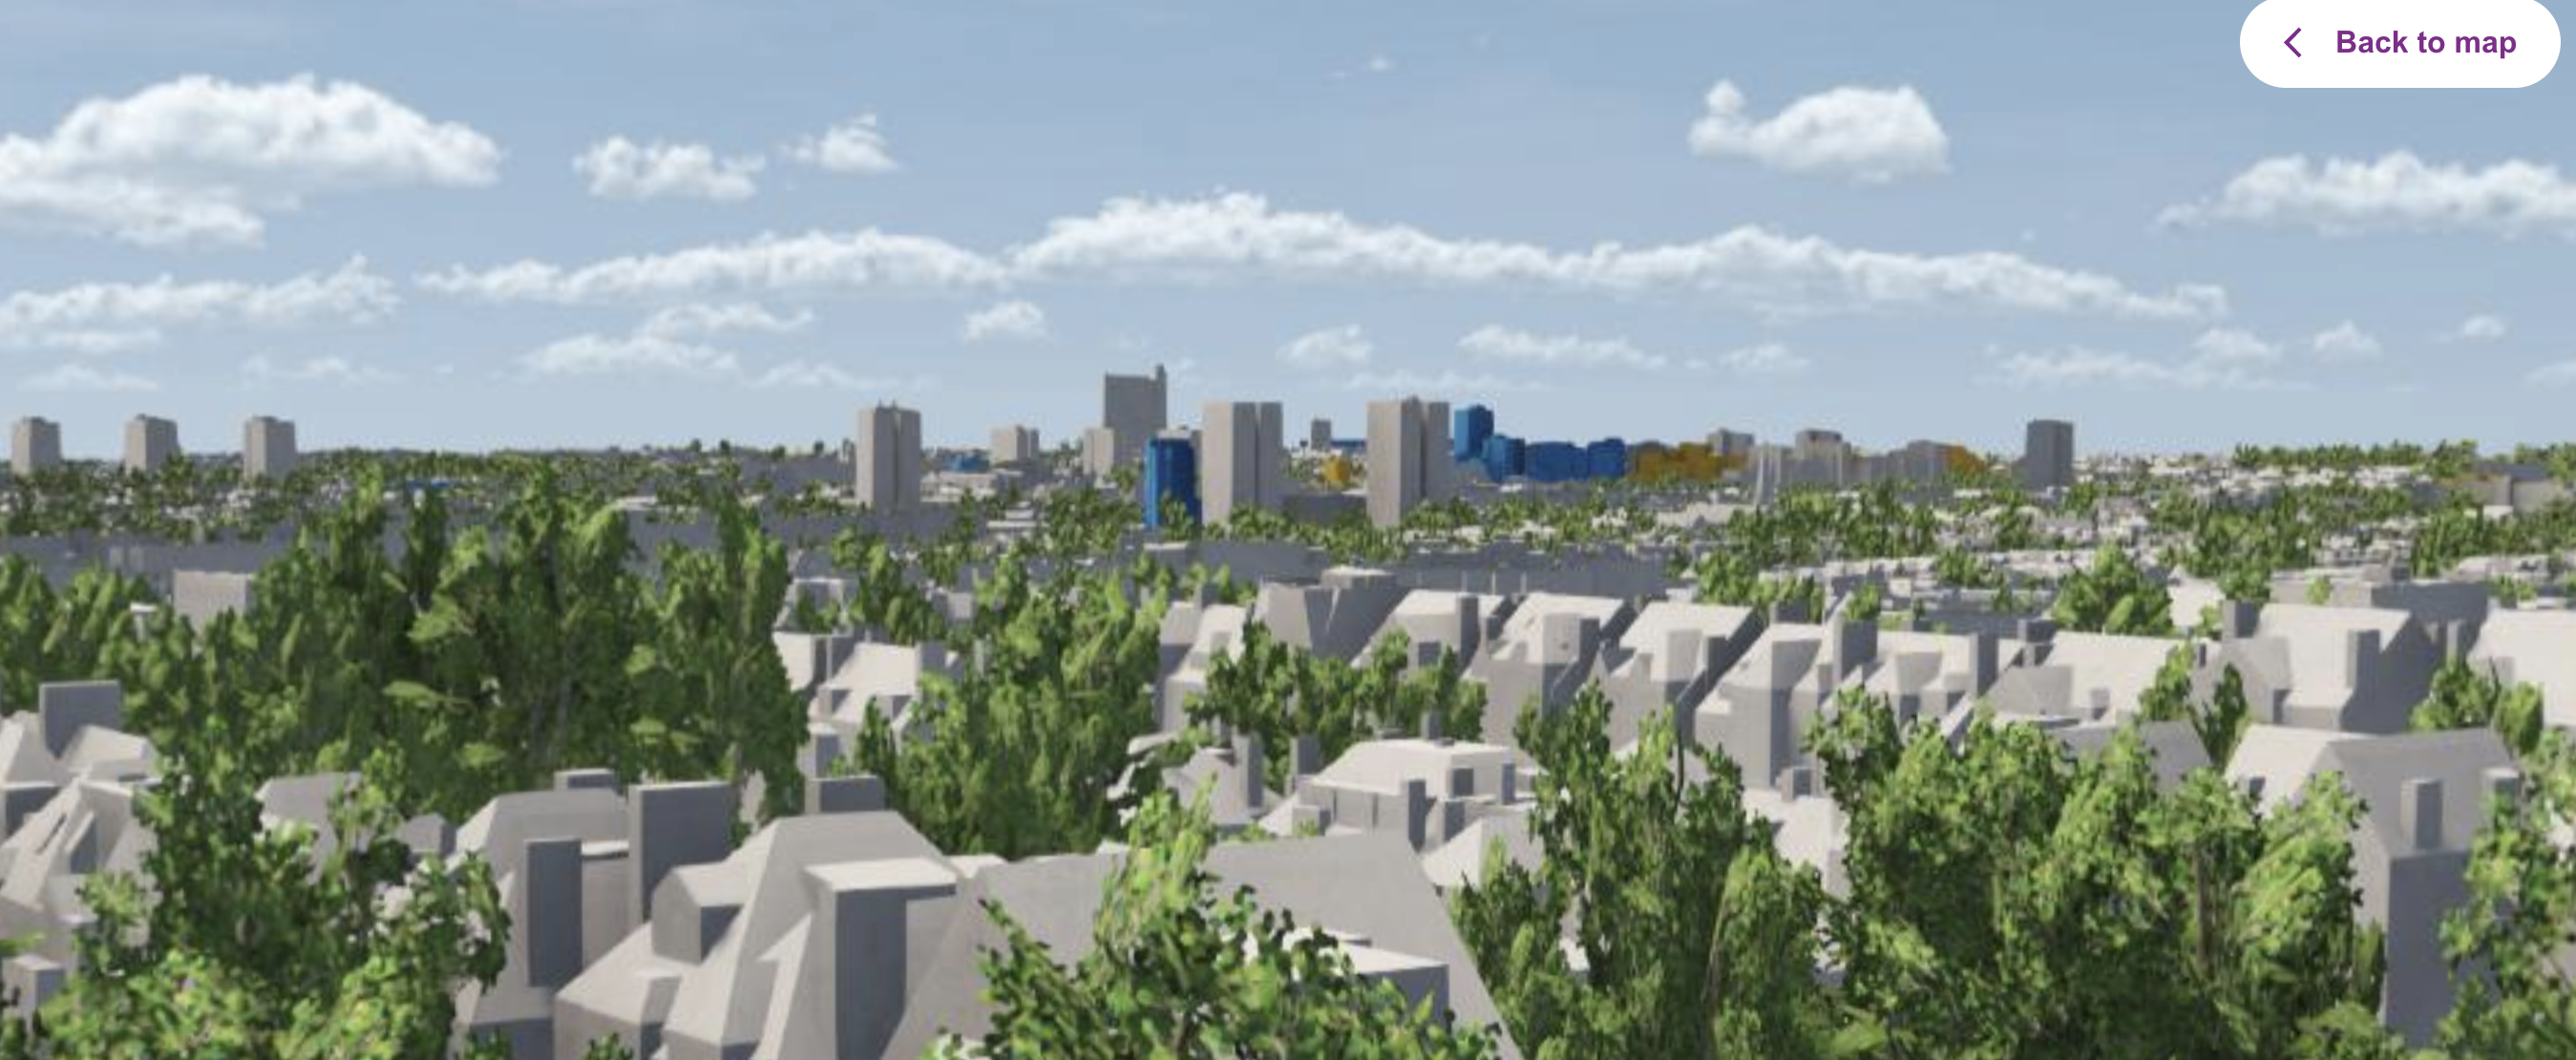
3D points
3D points can be placed on the map. If clicked respondents see a 3D view of this location. If you have your own 3D these can be added with the help of your CSM, if you require 3D views talk to your CSM about available add-ons through our partner vu.city.
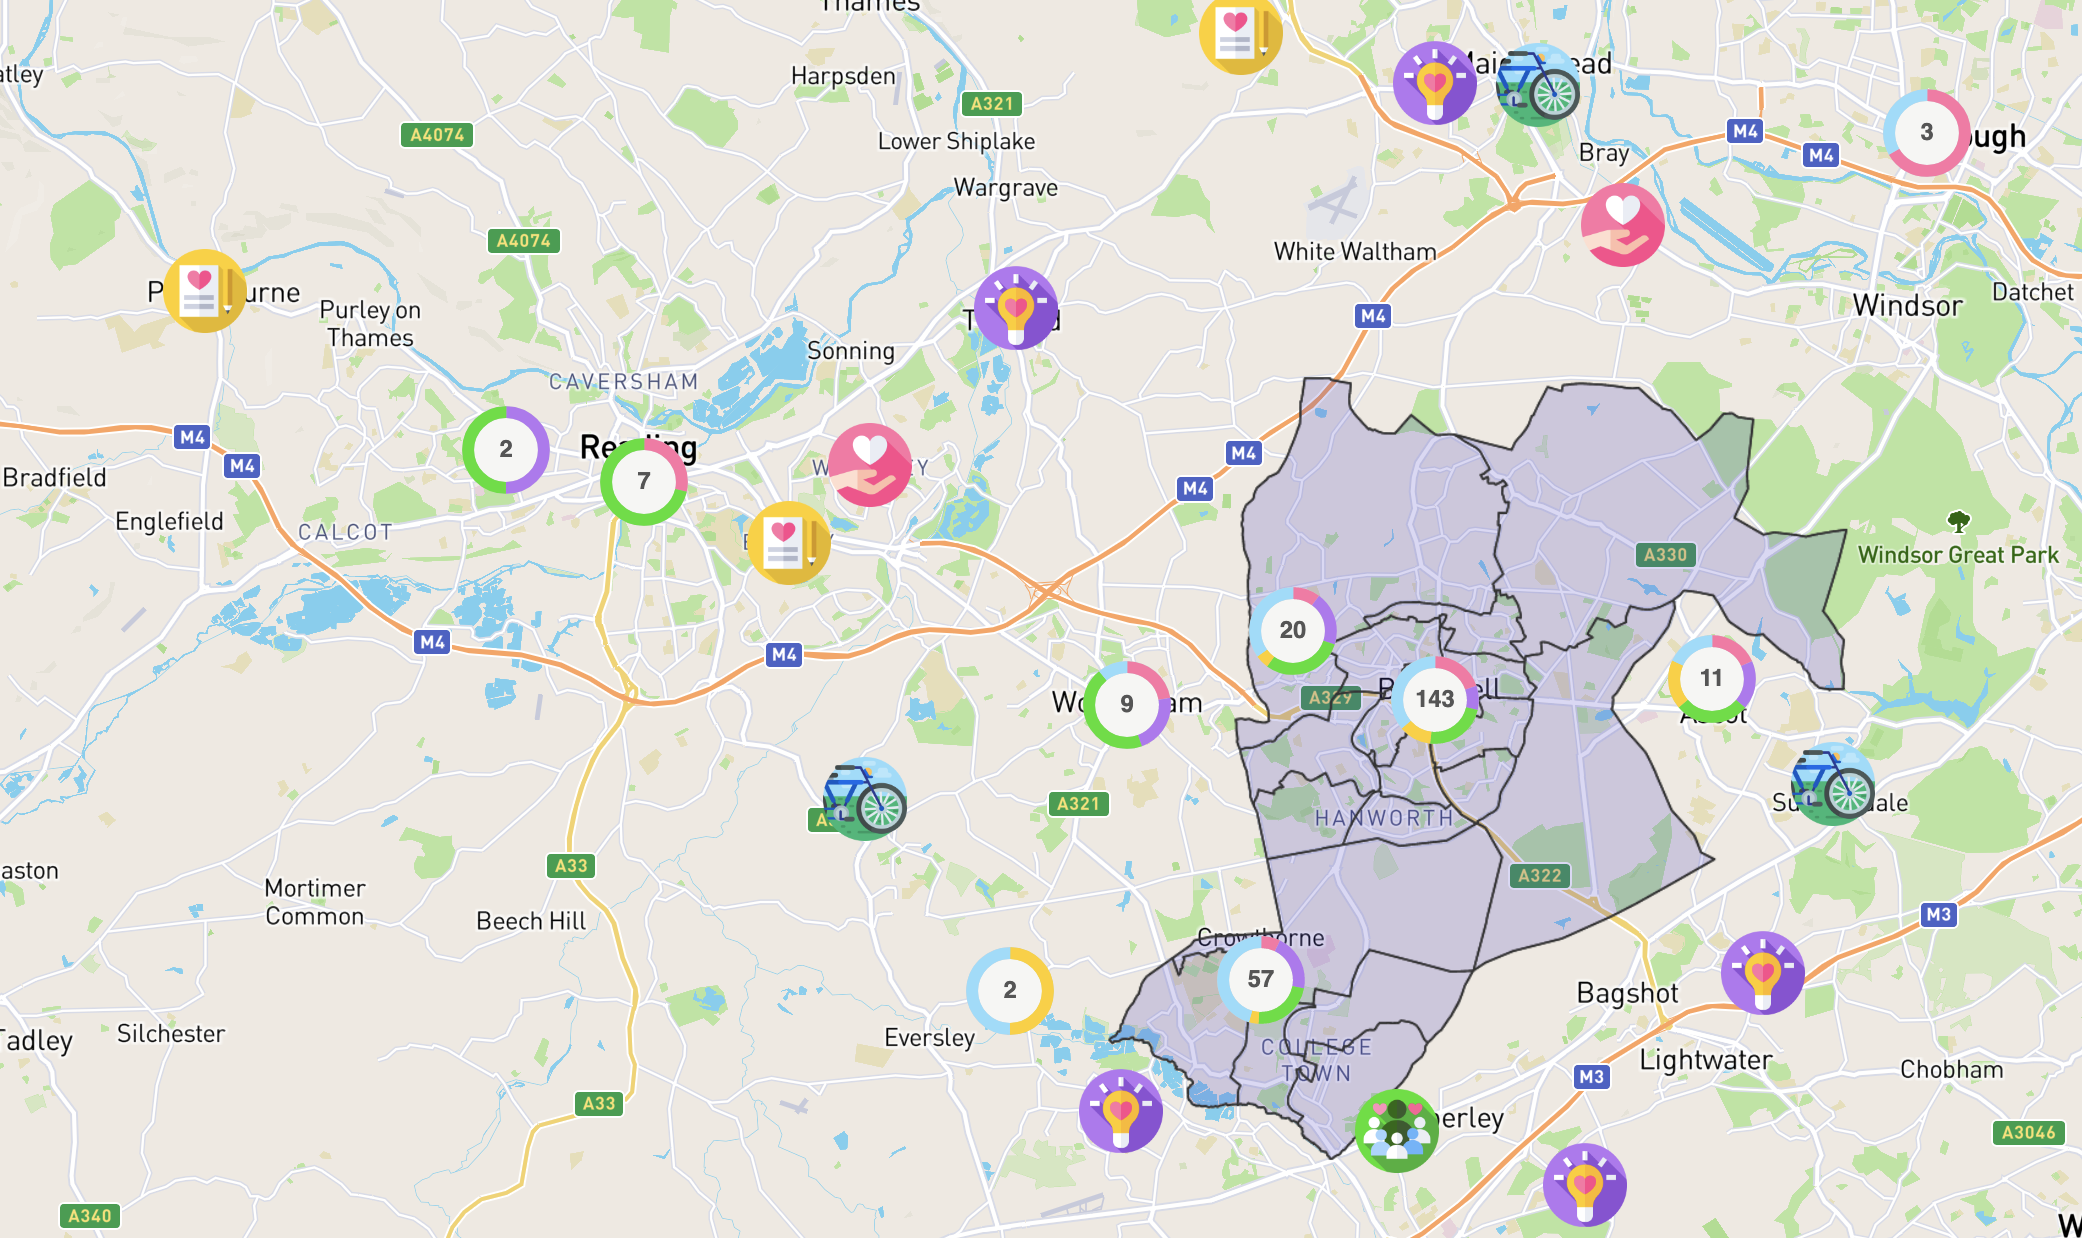
Sentiment pins and clusters
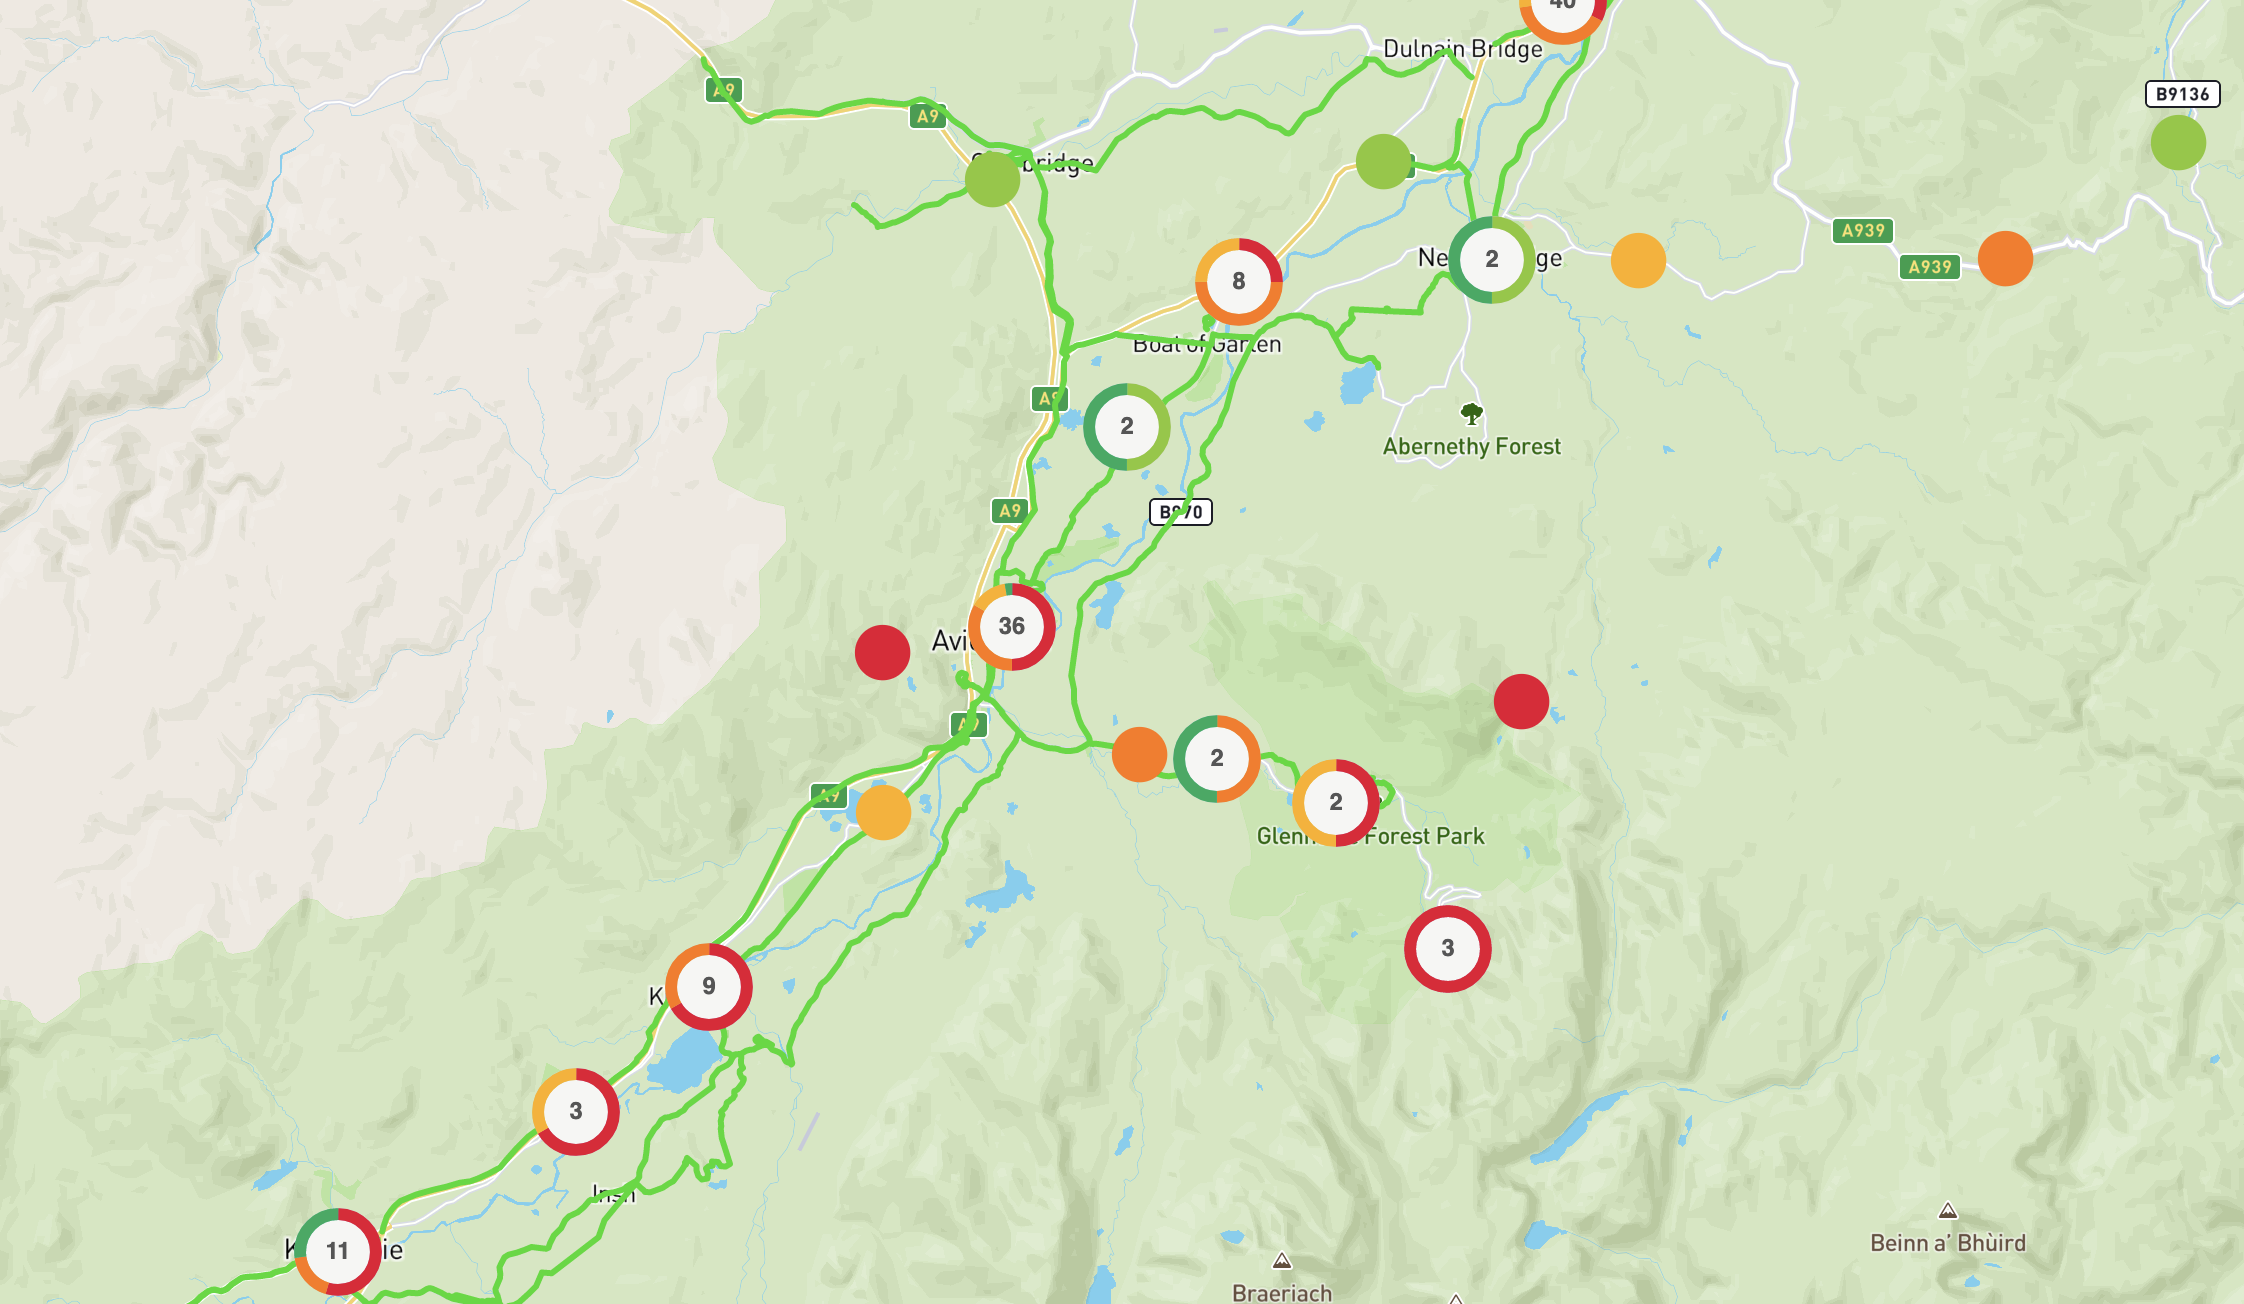
Example: Regular 2.0 map with lines that represent cycling and walking routes.
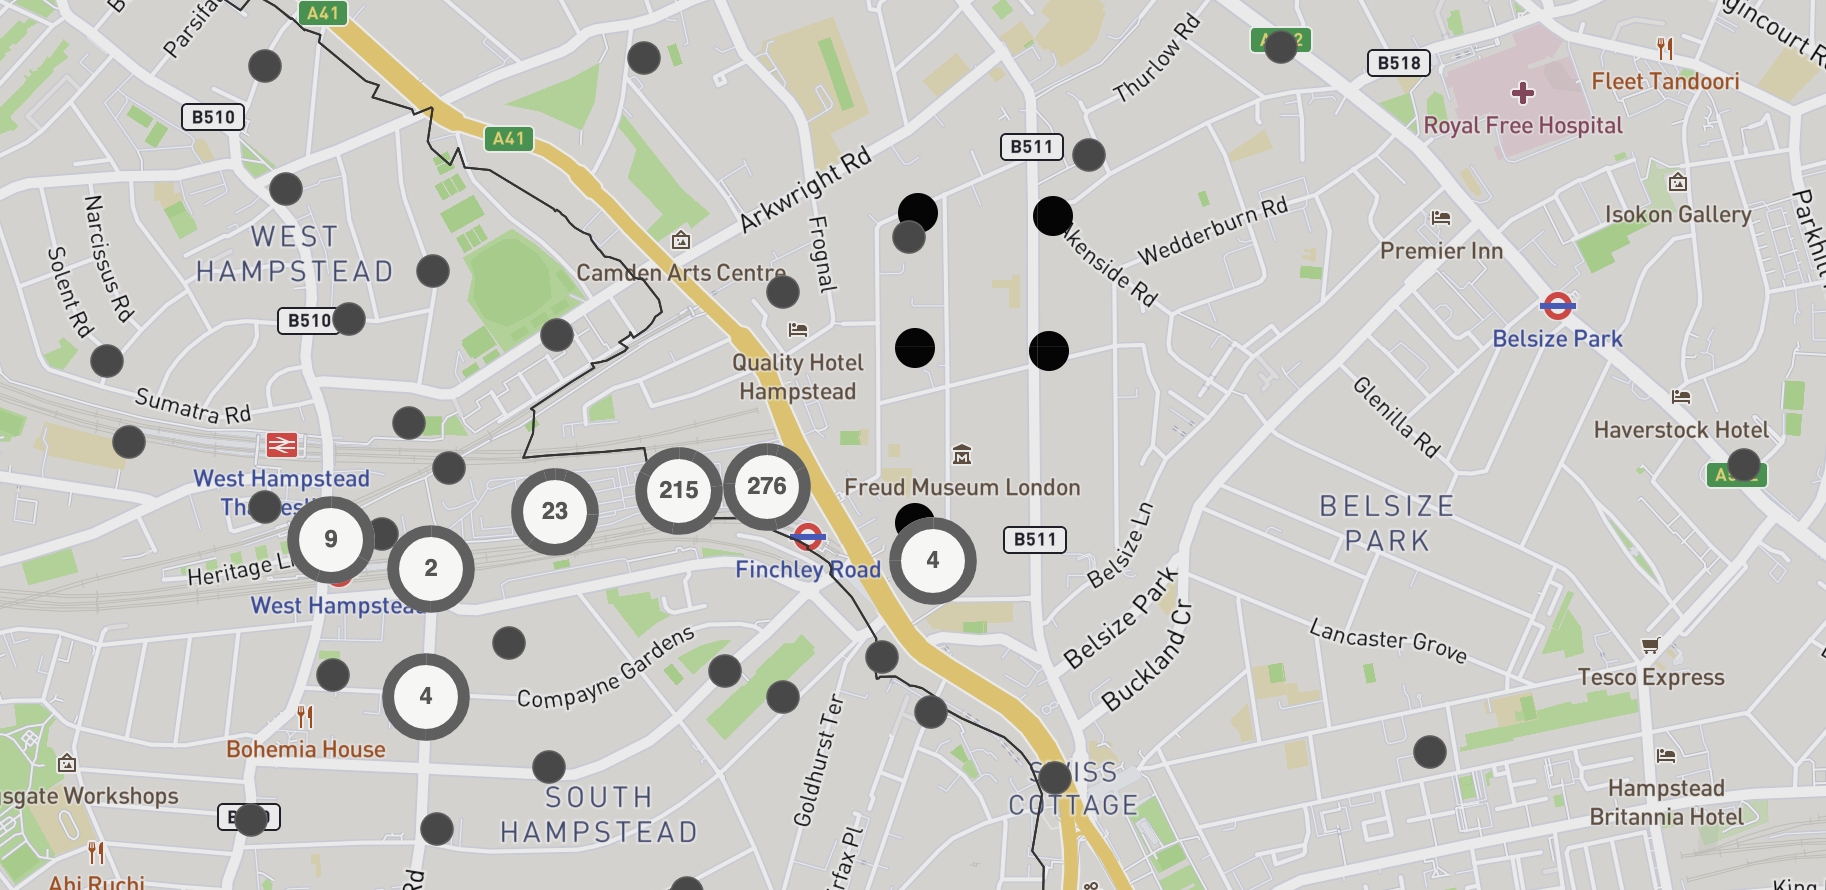
Neutral pins
We always recommend including a sentiment question in your map questions. Map pins and clusters don't need to represent sentiment, they also don't need to be a shade of grey, a purple or another colour that matches your branding may be more suitable.
There is also the option to set a threshold so that over X comments the pins become sentiment coloured. This may be useful if the engagement is likely to attract particularly opposing views.
Themed pins
Pins can also represent a category or theme. An answer that a person provides determines the look of the pin. For this to work well we recommend: 1. No more than six themes 2. Colour code themes with distinct colours, so that the cluster can show a summary of the themes.