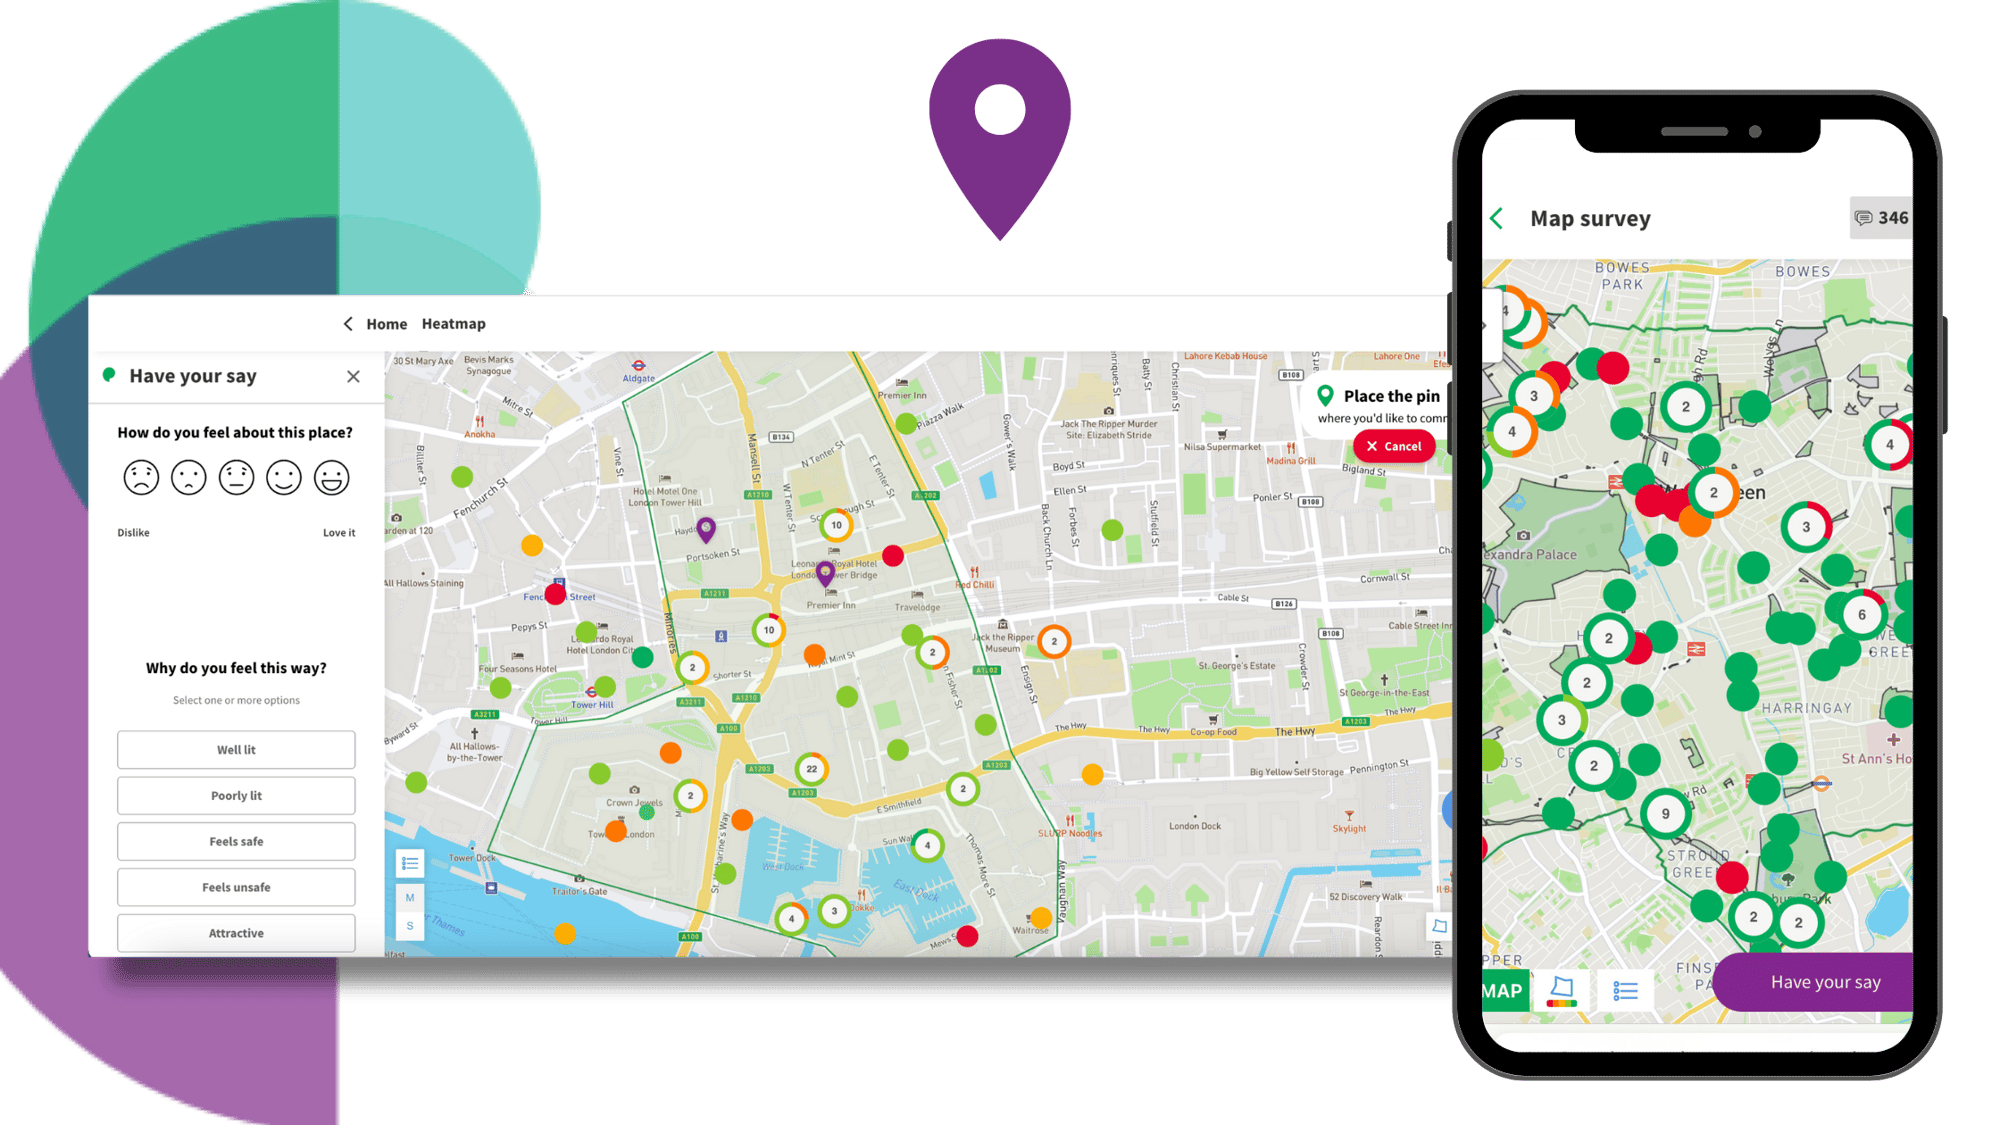
Contact us
Engage

Community Heatmap

The ultimate geo-spatial tool to help you engage with your community and visualise feedback on a map.

Book a Demo
Commonplace heatmap

Map out your community conversations

Create interactive maps for your place-based engagements. Add rich layers of data onto your map to make it easier to present, capture, understand community feedback and co-design. Use it to locate community spots, places of interest, demographic information about populations and much more.

1

Build engaging maps that showcase your projects

Create beautiful, interactive maps that help to demonstrate your proposals by adding: 

  • Shapes/Polygons
  • Informational layers
  • Focal points
  • Boundaries

...to add detail and context to your engagement. Our maps bring planned developments to life and make it easy for your community to share their thoughts and insights.

2

Tap into local knowledge and pinpoint ideas

Your community members can choose the exact location they want to comment on by dropping a pin on your heatmap. 

They can then answer a series of customisable questions as well as make suggestions, share ideas, or agree with other comments.

With Map as a question, you can also gather spatial information from your respondents.

3

Model your projects in 3D

Let your community members immerse themselves in your plans and proposals by integrating VU.CITY's digital twin software.

In 3D mode, visualise all planned changes within the existing context; see where new buildings and roads will site, and how these developments will affect the area around them. This makes it easy to discuss your plans with residents, stakeholders and developers.


4

Highlight focal points

Add interactive, clickable tiles to your map. When you click on one, you will be able to see additional information, images, videos and galleries.

Great for providing further context, illustrating plans and telling the story of your project.

5

Display new developments in the context of the wider area

With the Image on Map feature, adding overlays to highlight changes in an area is simple.

Want to show the impacts of a new traffic junction? Keen to display how a master plan will sit in the context of the existing landscape? Both of those are possible by superimposing your image on top of the map.


Explore other features

  • 1
    Reach-2

    Reach

    Promote and build awareness of your engagements and get more people to participate.

  • 2
    Engage-2

    Engage

    Collect suggestions and ideas from your community on a range of different topics

  • 3
    Analyse-2

    Analyse

    Explore and understand real-time community insight with ease.

  • 4
    Collaborate-2

    Collaborate

    Continually engage throughout the process, share updates and build trust.