.png)

3 min read
Welcome to a world of geo-spatial engagement and analysis beyond dropping a pin. This is the first of a three-part series of updates dedicated to our heatmap. Three weeks for three engagement altering changes that demonstrate how the new heatmap unlocks better engagement, analysis and collaboration. Today is about engaging your community, read on to put transformative mapping software front and centre.
Engage
Rome wasn’t built in a day, but if it was, it would have been a lot less complicated. The world we live in is instead inherently complex and multi-faceted, with many years creating layers of changes to unravel. With this in mind, we’ve designed our new heatmap to enable access to the fine and complex details that make up places.
The new heatmap works around the ability to add and remove layers. This gives you and your team granular access to the experiences of those who walk the streets, use the transport, live in the houses and work in the offices. It is these people and their opinions that are the key to unlocking effective and sustainable change.
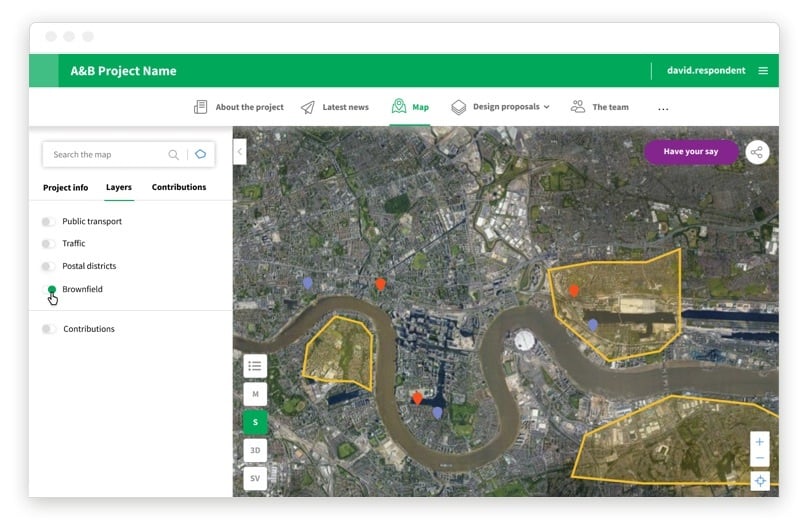
What do we mean when we talk about layers?
The new heatmap enables you to add presentation, demographic and data layers to better present and capture information. Presentation layers can apply to the existing environment (e.g. presenting existing cycling routes to invite comments on) or future outcomes (e.g. presenting potential cycle routes to invite comments on). Data and demographic layers help you engage with specific areas and populations.
Presentation layers
- Customisation
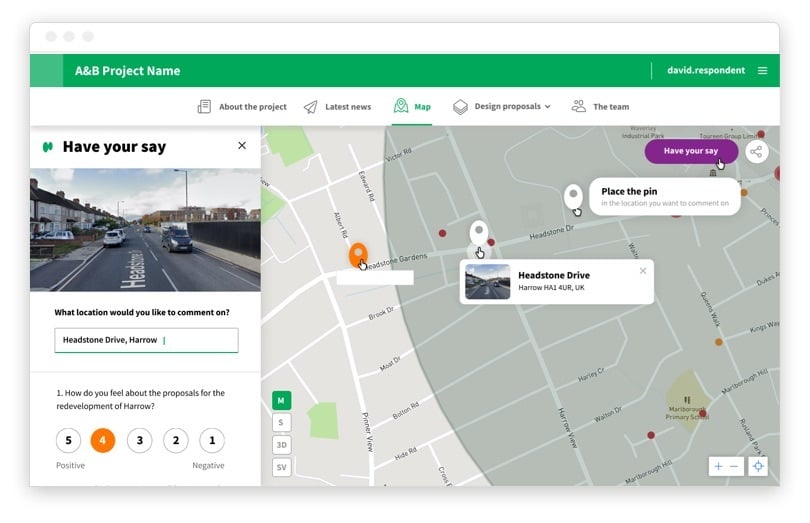
One of the core features of the new heatmap is its flexibility. You can invite the community to comment on various areas and/or topics within the built environment. For example, if you wanted to understand active travel in an area, you could invite comments by choosing to present existing cycle routes. Alternatively, if you wanted to gather opinions on new possibilities, you could present future cycle routes. You can add any line or polygon shape to your map, labelling it appropriately, or even add points to link off to specific proposals.
- Masterplans
Layering gives you the flexibility you need to communicate your project with your community, and ensure they can give you direct and place-based feedback. This is particularly important when gathering opinions on specific designs or masterplans.
You can now drop a Masterplan directly onto the heatmap within its context and welcome comments directly on to the plan. Not only does this give the community context to their thoughts and feelings about a project, it gives you the opportunity to highlight specific areas of a project for commenting. Engagement is therefore more directed and more granular, giving you the opportunity to find out exactly what you want to know.
- 3D view
The heatmap has a 3D mode, enabling your community to explore the project in 3D. We’re currently exploring ways in which one day the community will be able to drop pins whilst viewing projects in 3D. Right now, you can add your proposed 3D designs into their 3D context, enabling the community to view the proposals in-situ and to scale. Yet, even if your project doesn’t include 3D modelling, the community is able to see their area in 3D which provides them with vital context to imagine change and place their thoughts within the spaces.
Data layers
- Cross-referencing context and comments
The heatmaps’ customisability is its defining feature. The ability to add data layers opens a whole new world of possibilities in terms of understanding your comments in context. For example, data layers can help you cross-reference behaviour with results from your community engagement. You could choose to compare your active travel engagement results with places that have the most vehicle or cycle accidents, giving more insight into the existing picture and what needs to change.
- Local data
Geo-spatial data layers will enrich the map experience for respondents and step-change your analytical capability. The heatmap enables you to draw custom polygons or circles in order to help respondents navigate the map, restrict comments to a certain area and analyse the comments within your custom shapes. Go further and layer on socio-demographic, transport, lifestyle and climate data to build your community story or benchmark your project performance. These local data features bring enterprise GIS to your community engagement.
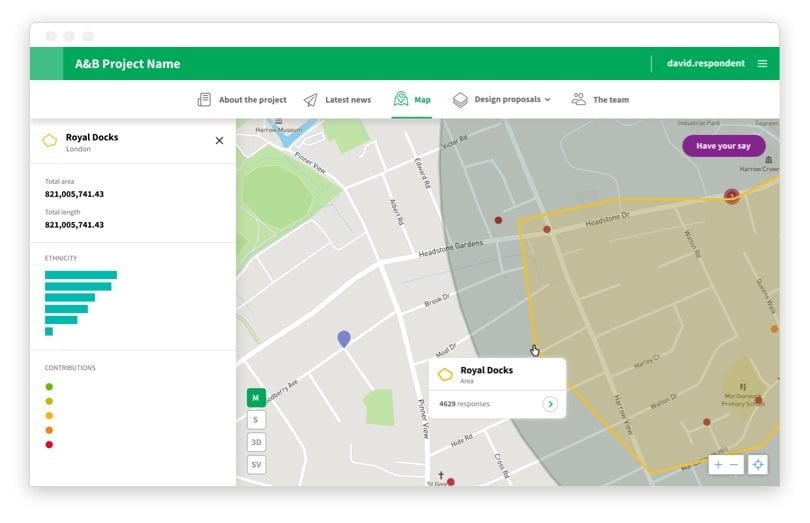
- Demographic data
Alongside geo-location layers, the heatmap enables you to add demographic data layers to give you visibility over the community you’re engaging with. For example, if your engagement is bringing in a high number of comments from a younger generation, you can compare demographic data to see if this is truly reflective of the total population living there.
When you aren’t reaching a target community, this data can help you rebuild the strategy around your engagement to extend its reach. For example, being able to add ethnicity data for different areas will enable you to ensure harder to reach communities are brought into the conversation.
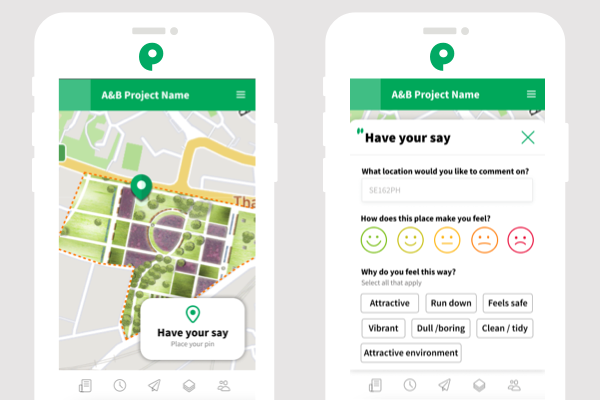
Mobile Optimisation
Over 70% of respondents from the community will access your project site through their mobile phone. Commonplace 2.0 has been optimised for mobile to ensure your projects are built in the most suitable way for the most popular method of engagement.
The heatmap works seamlessly on mobile in both 2D and 3D, with easy scrolling and adaptable layers, accessing projects on the go from a mobile device is an effortless and engaging experience. Users can easily drop a pin on the map from their mobile, and the new user interface makes this commenting process simple and easy to use.
When can you start using the new Heatmap?
We've already starting deploying the map to some Commonplaces as part of our beta test. If you'd like to be part of the rollout, do get in touch.
Now! We’ll be shifting all projects to the platform by the end of July 2021, but why not join the other customers using Commonplace 2.0 sooner? To get your projects transferred onto the new platform, join the waiting list by contacting us below.