.png)

2 min read
Off the back of our annual customer survey back in December, we’ve changed the way you can view and filter your engagement results to make those key stats even more accessible.
Up until recently, when our customers wanted to see the engagement results of various parts of their project, they would have to download a CSV and fiddle through a spreadsheet. Whilst this is a process many of us in the working world today are extremely familiar with, we’ve been asked by our customers to make this an even easier process.
One of the biggest perks of digital engagement is data. Data is fluid, accessible, storable, and most importantly transparent. And our product team is always working behind the scenes to make sure you’re getting the best outputs for your team from online engagement that you can.
Filter by....
The filter option we're talking about today refers to the various individual modules of your project. Each customer will have chosen to call these one of four things when they created their Commonplace:
- Proposals
- Themes
- Sections
- Pages
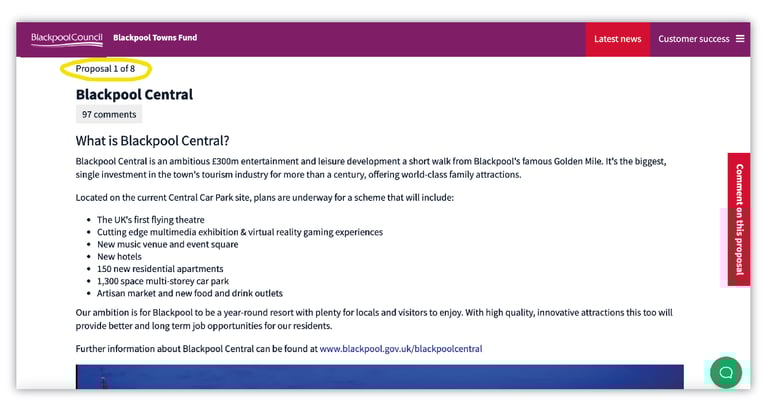
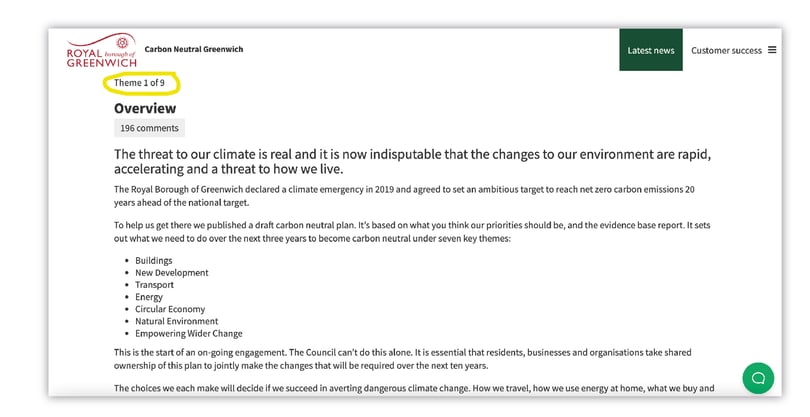
Each refers to the same thing. If you aren't sure which term your project uses, you can find it at the top of each page open to public comments as shown in the images below.
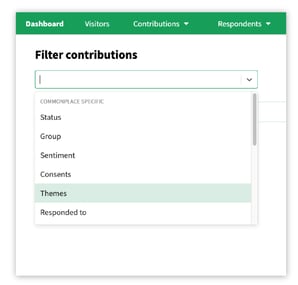
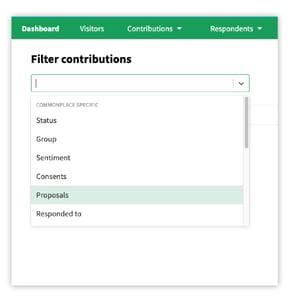
How to filter your comments?
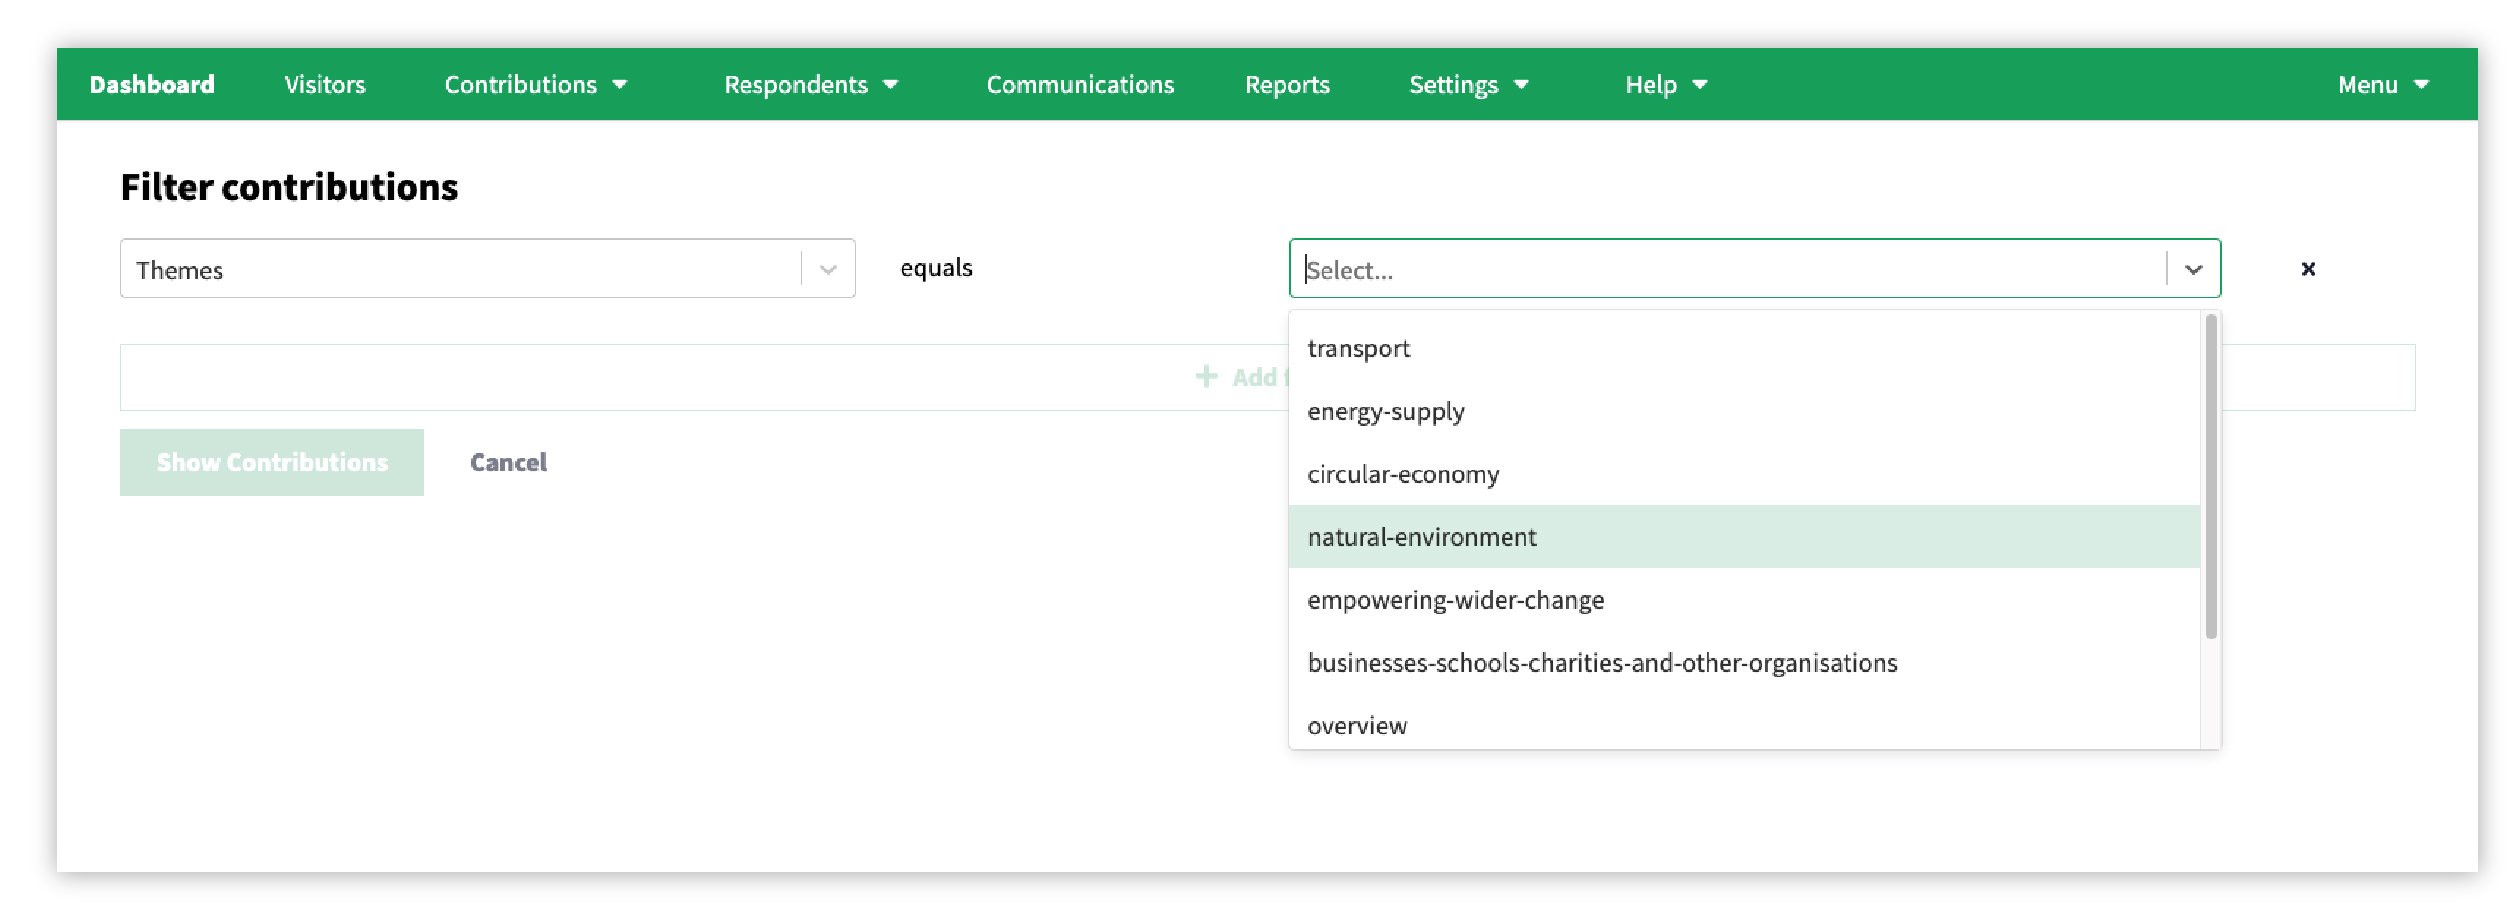
When you go to review your comments on your dashboard, there’s the option to add filters. Once you have selected the filter (proposals, themes, sections, or pages), a second dropdown menu will appear to the right of the page where you’ll be able to select any of the individual modules with your project. Anywhere on your project where the public has the ability to comment you’ll be able to filter and view it here.
Example 1: Filter by 'Themes'
To demonstrate this process, we have selected two examples. The 'Themes' for the first example are: transport, energy supply, circular economy, natural environment, and so on.
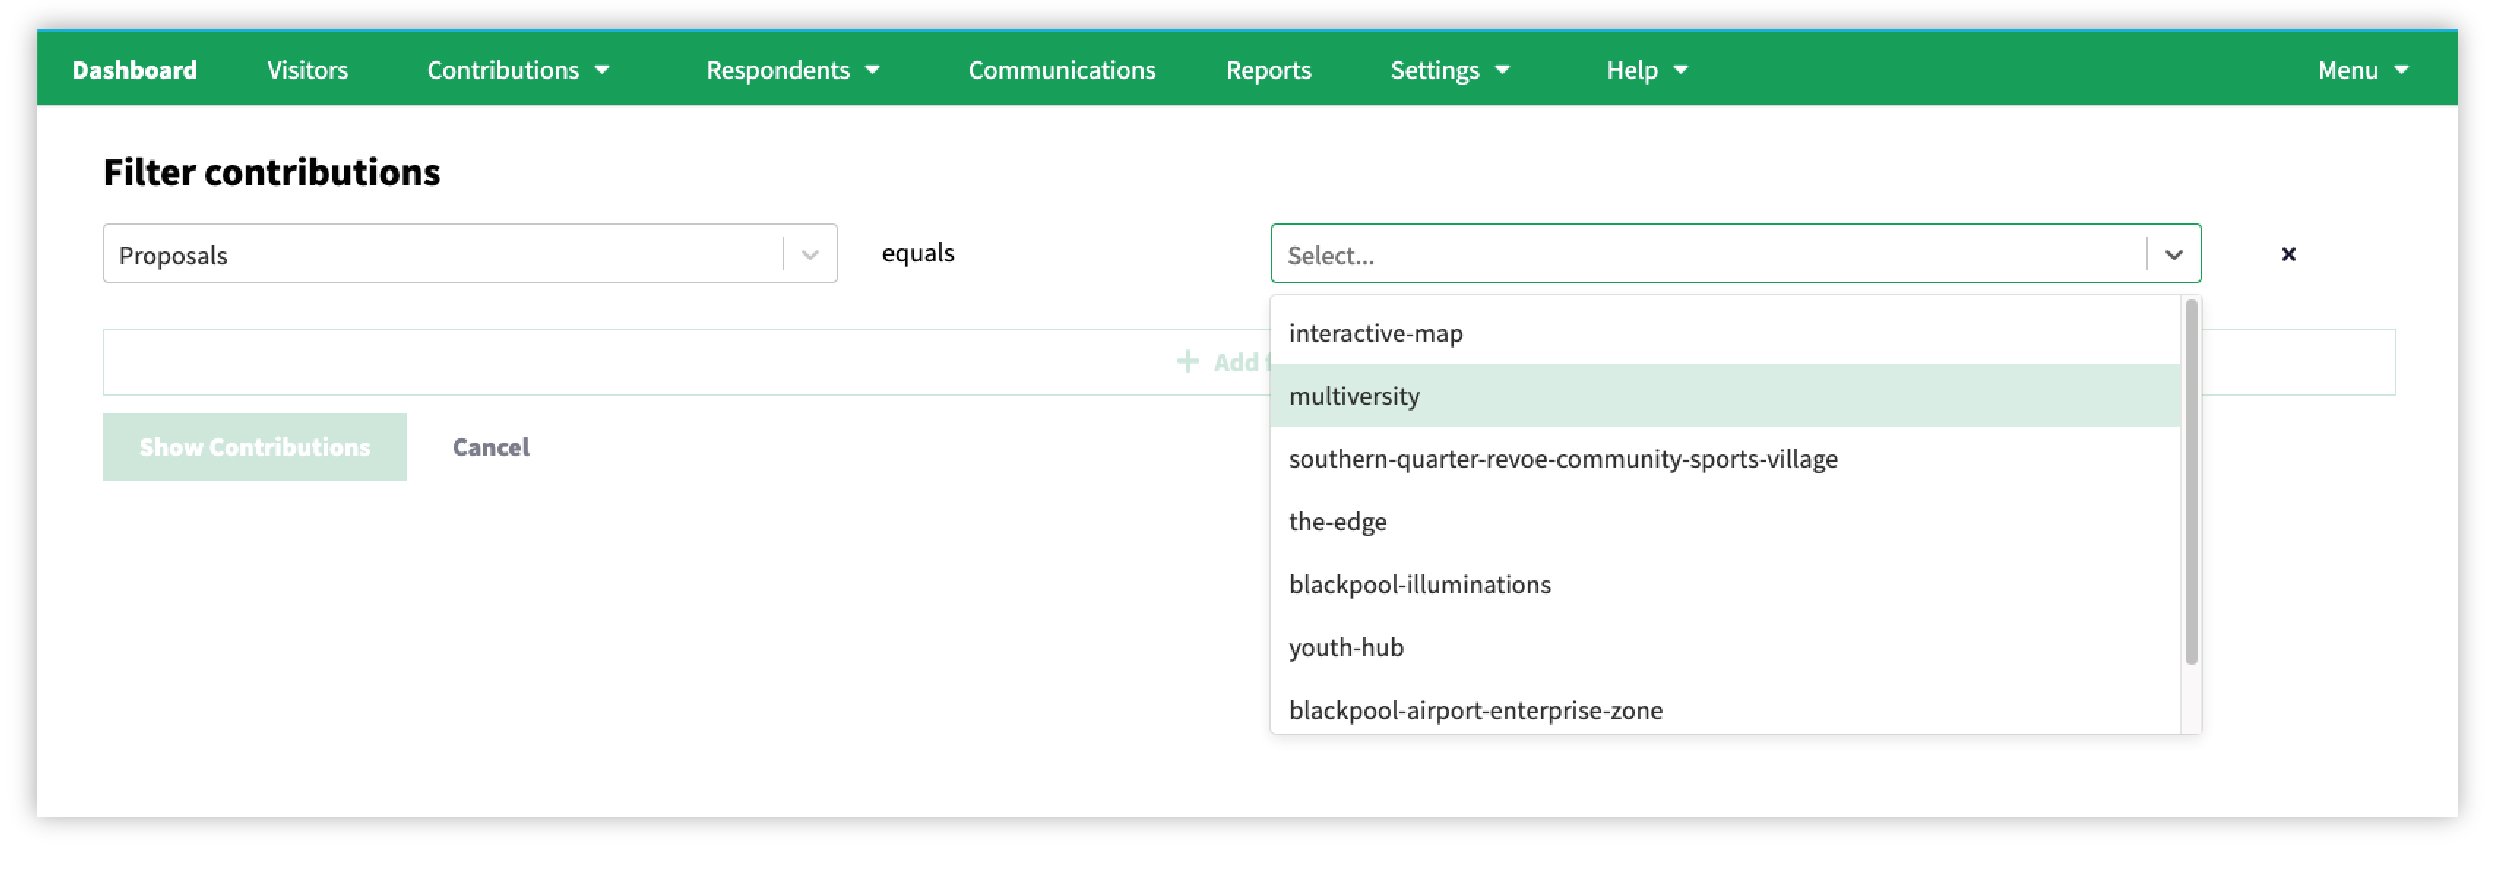
Example 2: Filter by 'Proposals'
The 'Proposals' for the second example are: interactive map, multiversity, southern quarter revoe community sports village, the edge, and so on.
To explain the process in a little more detail, we have put together this short video to guide you through it.
What next?
Now you have even easier access to responses from your project and this opens the door to better engagement. You can categorise the responses and browse the comments, or use ‘command + F’ (for mac) and ‘ctrl + F’ (for windows), to search the comments for specific words (we’re working on a keyword search solution within the dashboard itself). This can help you better understand popular pain points for the respondents, if an aspect of the development is coming up time and time again, you’ll have a clearer idea on how to revisit it with the public in mind.
Filtering also gives you the perfect opportunity to respond to public comments. Easily accessible reply buttons make this a quick and easy process to run through some comments and let the community know your position on their thoughts. You can do this on individual comments on group contributions by filter, and send specific emails to that group. This is what we call ‘closing the loop’, and helping our customers achieve this is one of our core goals.
Find out more about how we're helping you close the loop through continuous engagement here.
Want to learn more?