.png)

1 min read
As part of the constant evolution of Commonplace tools, we’re happy to share with you some of the work that we’ve been doing on the Commonplace Project Dashboards.
Each project has its own dashboard, which summarises the progress of the project and is visible to appointed project administrators. The dashboard shows how many people have commented and what issues are most significant. It also provides easy mechanisms for sharing data from Commonplace with project stakeholders.
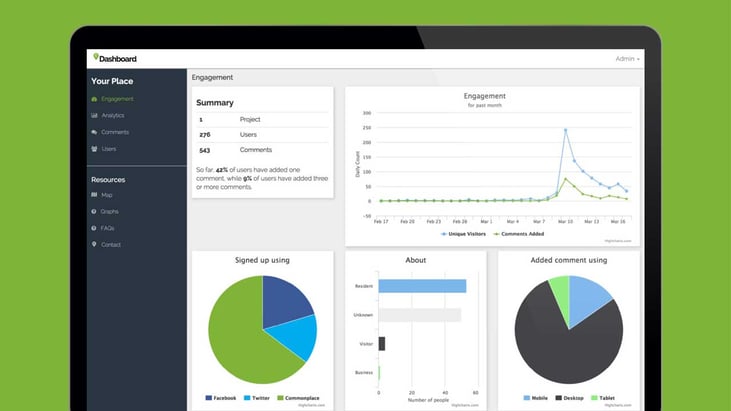
- Engagement Page This page shows how many people are responding to your Commonplace, who they are and what device they are using. How effective are your communication efforts, are you driving enough traffic to the project? What’s the relationship between visitors and people leaving comments? Could your project aims be communicated more clearly to encourage people to participate? The Engagement Page tells you at a glance.
- Better Analytics for participants’ comments We included new charts for conveying information better. We added five types of graphical displays: word cloud (which you already know), line charts (for displaying stats over time), bar charts, column charts and pie charts. All graphs allow you to see proportions and percentages quickly by hovering over graph areas.
- Users, Comments, Data Download As before, you can see the email addresses of users who have agreed to share their contact details; you can view a list of all comments chronologically, and you can download all data for further analysis and reporting.
More to come…
We are planning on doing more work on the dashboards, including easier sharing of graphs for internal and external project updates, more advanced reporting and the download of subsets of comments and demographic data… Get in touch and start a conversation with us about your project needs and keep your eyes peeled for more dashboard updates.